

How the Solo Connector Turned Two Weeks of Overpull Analysis into Two Hours
A 150-well project built in two hours instead of two weeks showed that overpulls follow slides into ash beds, and that geosteering can predict them.
Written by:
ROGII CTO Igor Kuvaev showed the International Association of Directional Drilling (IADD) how one geosteering interpretation, 150 wells of drilling data and a few plain-language prompts reveal where overpulls happen, and why.
Finding the pattern behind overpulls usually means stitching together drilling data, daily drilling reports (DDRs) and geology, well by well. Igor Kuvaev, ROGII’s CTO, asked Claude to do the stitching.
He had it pull a field’s Pason drilling data into Solo Cloud and DrillSpot. Two hours later he had a 150-well project: time-series and depth drilling data, BHAs, casings, DDRs and mud reports, all in one place. Then he asked:
That project became his IADD talk, Drill What the Rock Tells You: Integrating Geology into Shale Drilling Execution. The argument is simple: many drilling problems in shale laterals come from the rock, and the geosteering interpretation already shows where that rock is.
Your geosteering already knows where the trouble is
Geosteering is the interpretation of a lateral’s true vertical thickness (TVT): where the bit sits in the rock, not just how deep it is. TVT lines up every foot of every lateral against the same type well. So when drilling problems keep landing at the same TVT, the geology is pointing at the cause.

One project, every dataset, plain-language questions
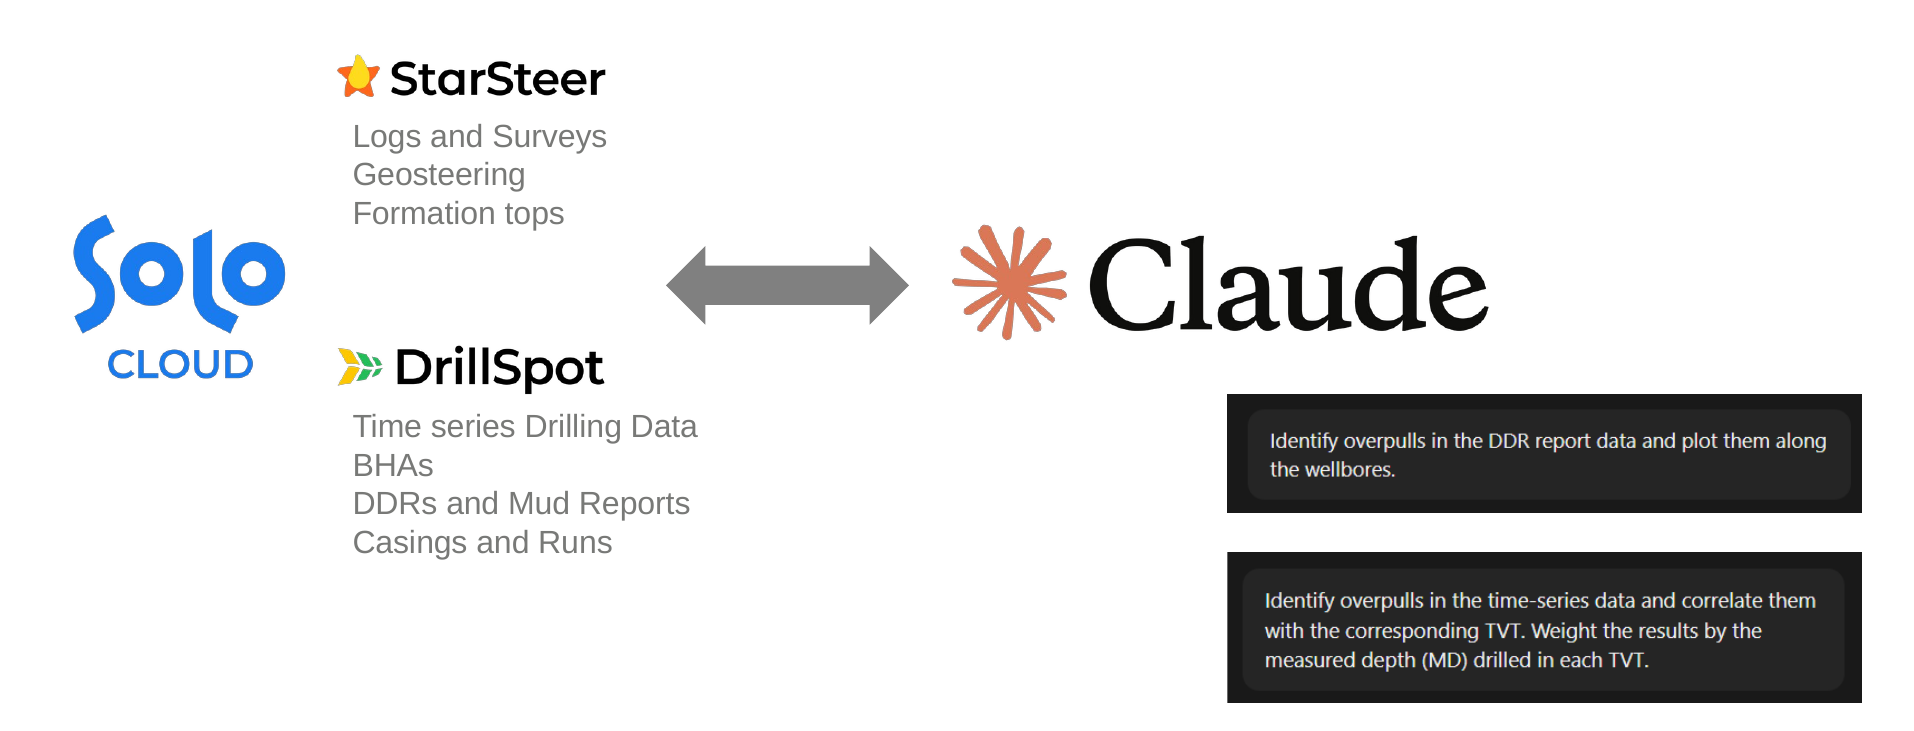
Linking drilling events to TVT needs geology and drilling data side by side. In Solo Cloud, StarSteer holds the logs, surveys, geosteering interpretations and formation tops. DrillSpot holds the time-series drilling data, BHAs, DDRs, mud reports, casings and runs. With Claude connected, Igor simply asked:
“Identify overpulls in the DDR report data and plot them along the wellbores.”
“Identify overpulls in the time-series data and correlate them with the corresponding TVT. Weight the results by the measured depth (MD) drilled in each TVT.”
Finding 1: Overpulls follow slides into ash beds
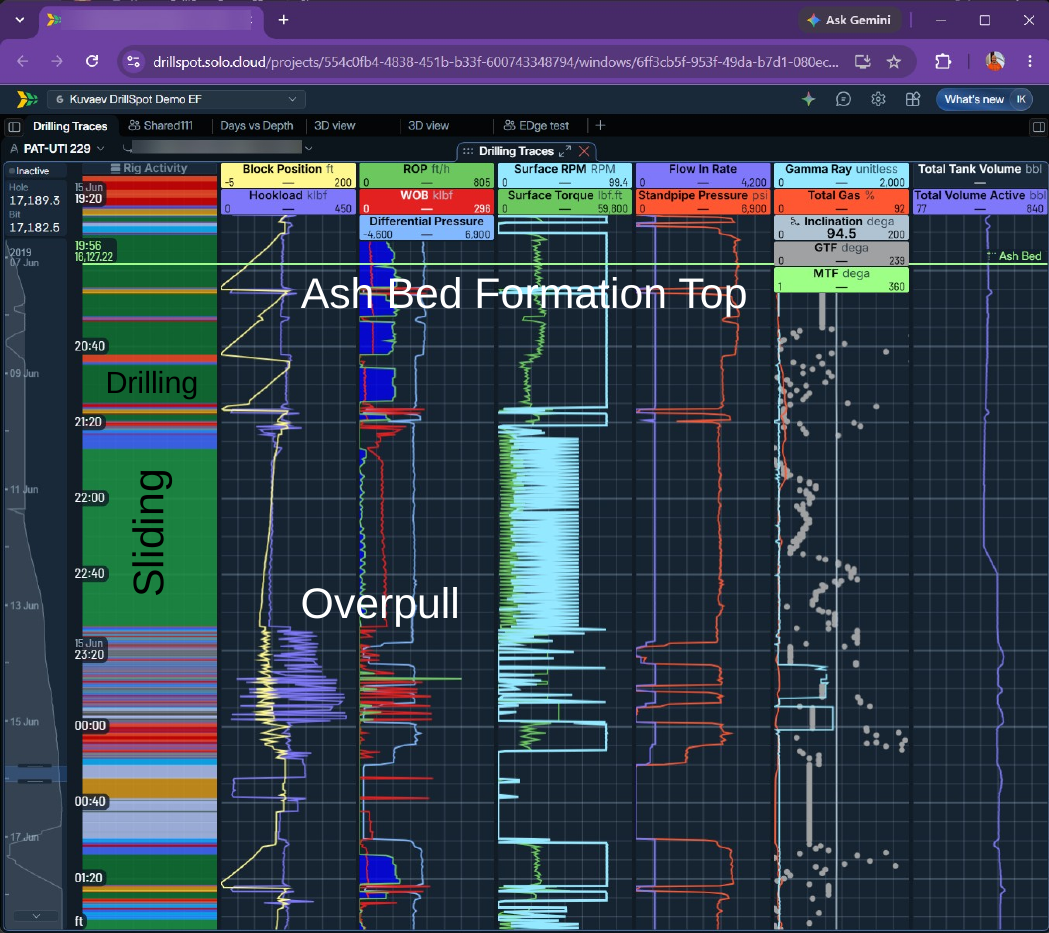
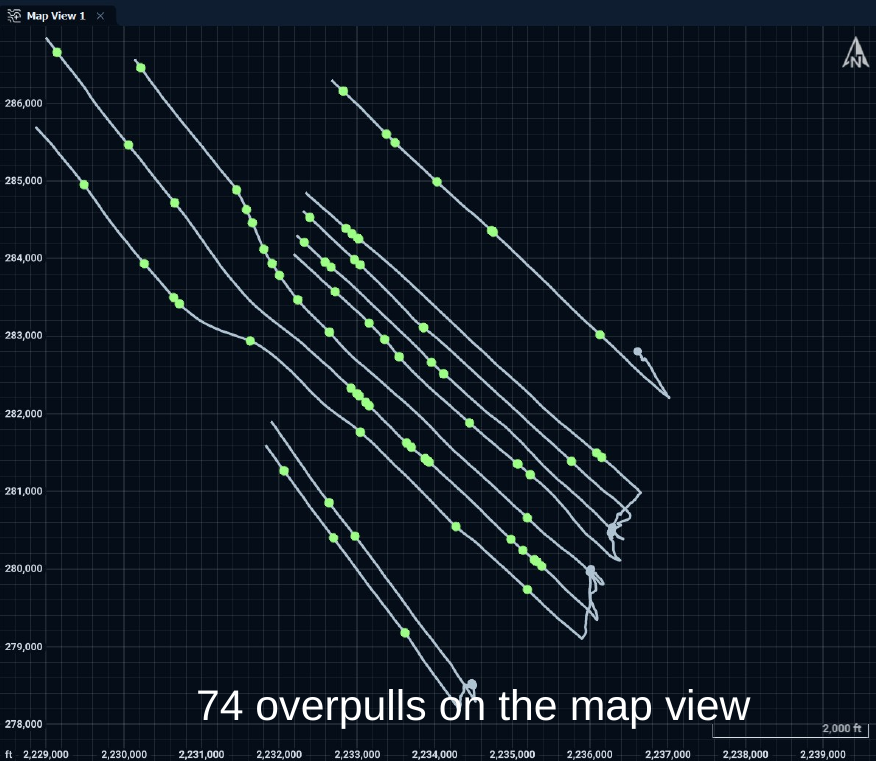
Plotting the overpulls reported in DDRs along the wellbores put 74 of them on the map. Zoom into DrillSpot’s drilling traces and one sequence keeps repeating: a slide, then an overpull, right at an ash bed formation top.
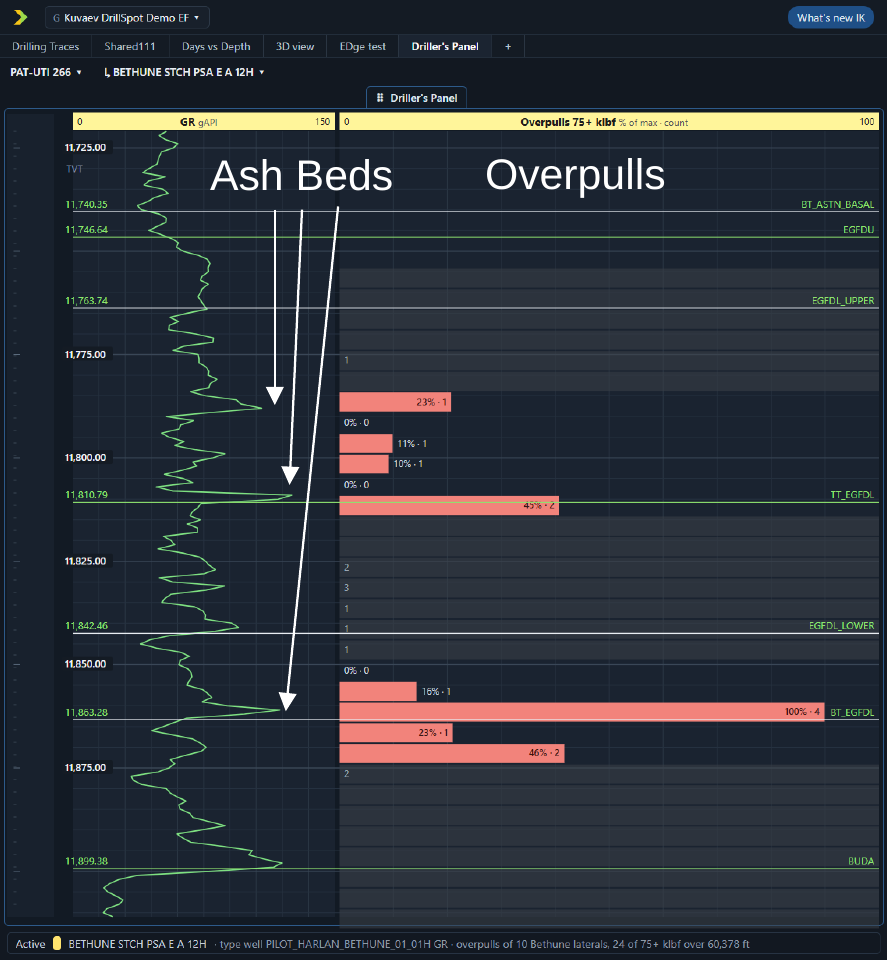
Next, Claude correlated overpulls of 75+ klbf from the time-series data with TVT across ten laterals. They stack up at the ash beds, the sharp spikes on the type-well gamma ray (GR).
Finding 2: The rock decides how much a slide builds
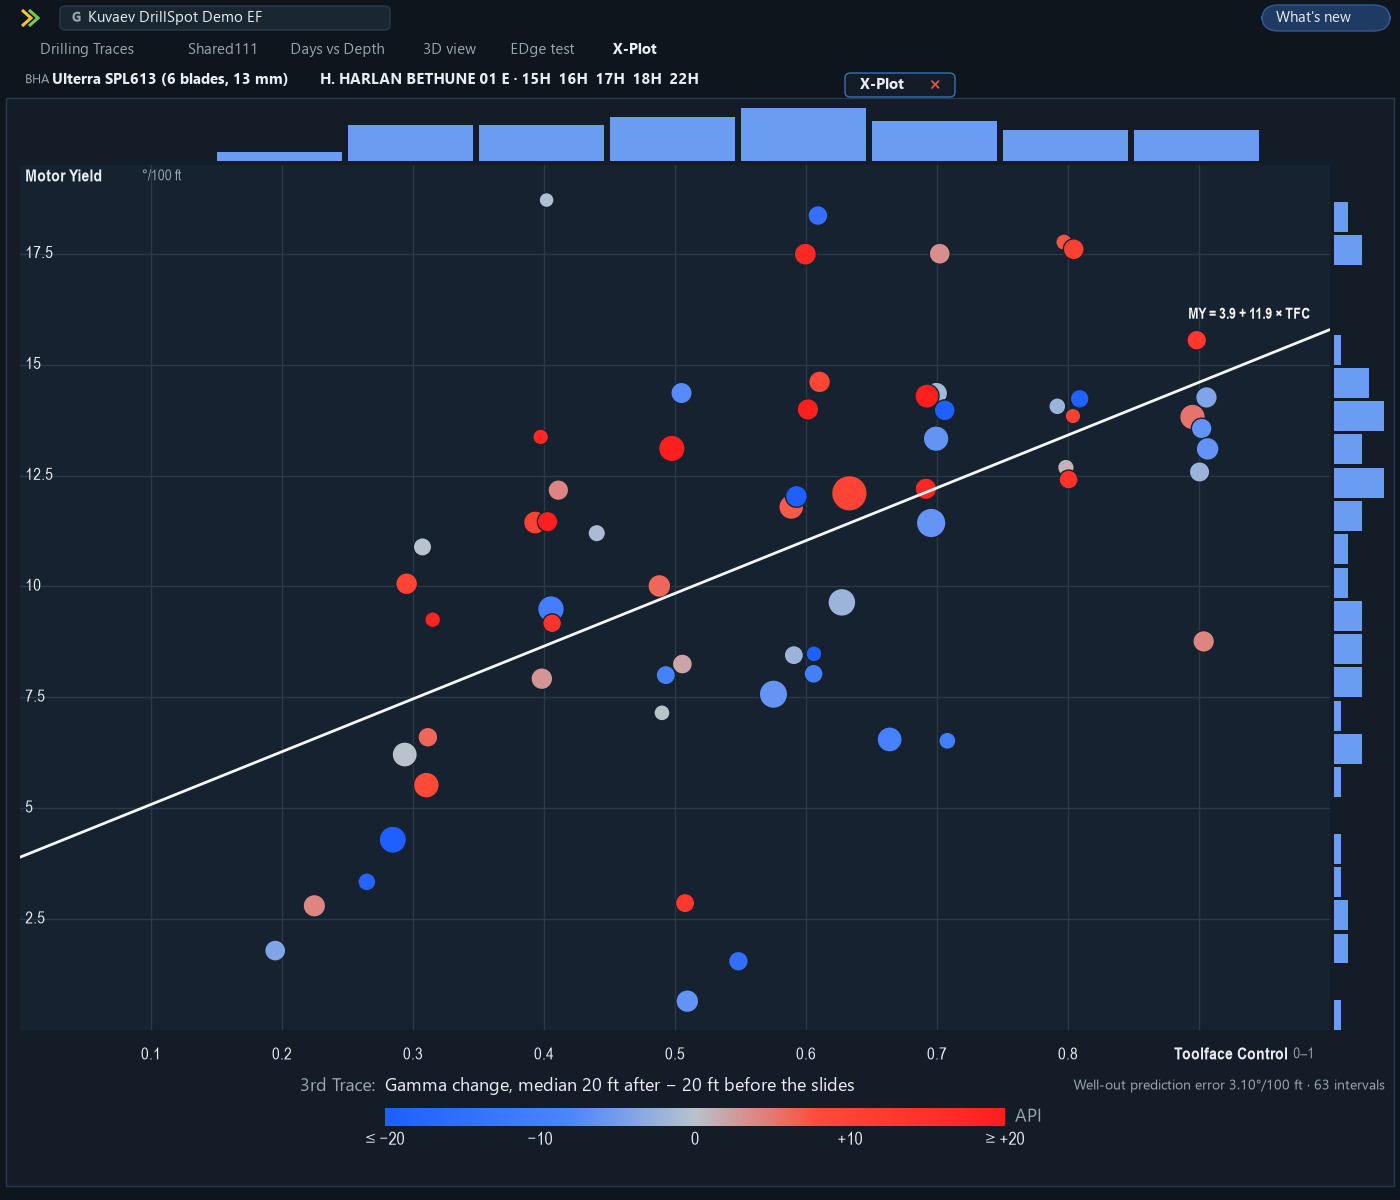
The same approach works for sliding. Igor plotted motor yield against toolface control for 63 slide intervals in DrillSpot, coloring each by the change in GR from 20 ft before to 20 ft after the slide.
Better toolface control generally means more yield. But the colors tell a second story: slides into higher-GR, softer rock (red) built more angle than slides into lower-GR, harder rock (blue). The rock ahead of the bit belongs in the prediction.
Drill what the rock tells you
Your geosteering team already maps the formation tops and ash beds. Put that interpretation next to the drilling data, and every drilling event can be read in TVT: where it happened, why, and where it is likely to happen next.
With Claude assembling the data, that takes hours, not weeks.


