
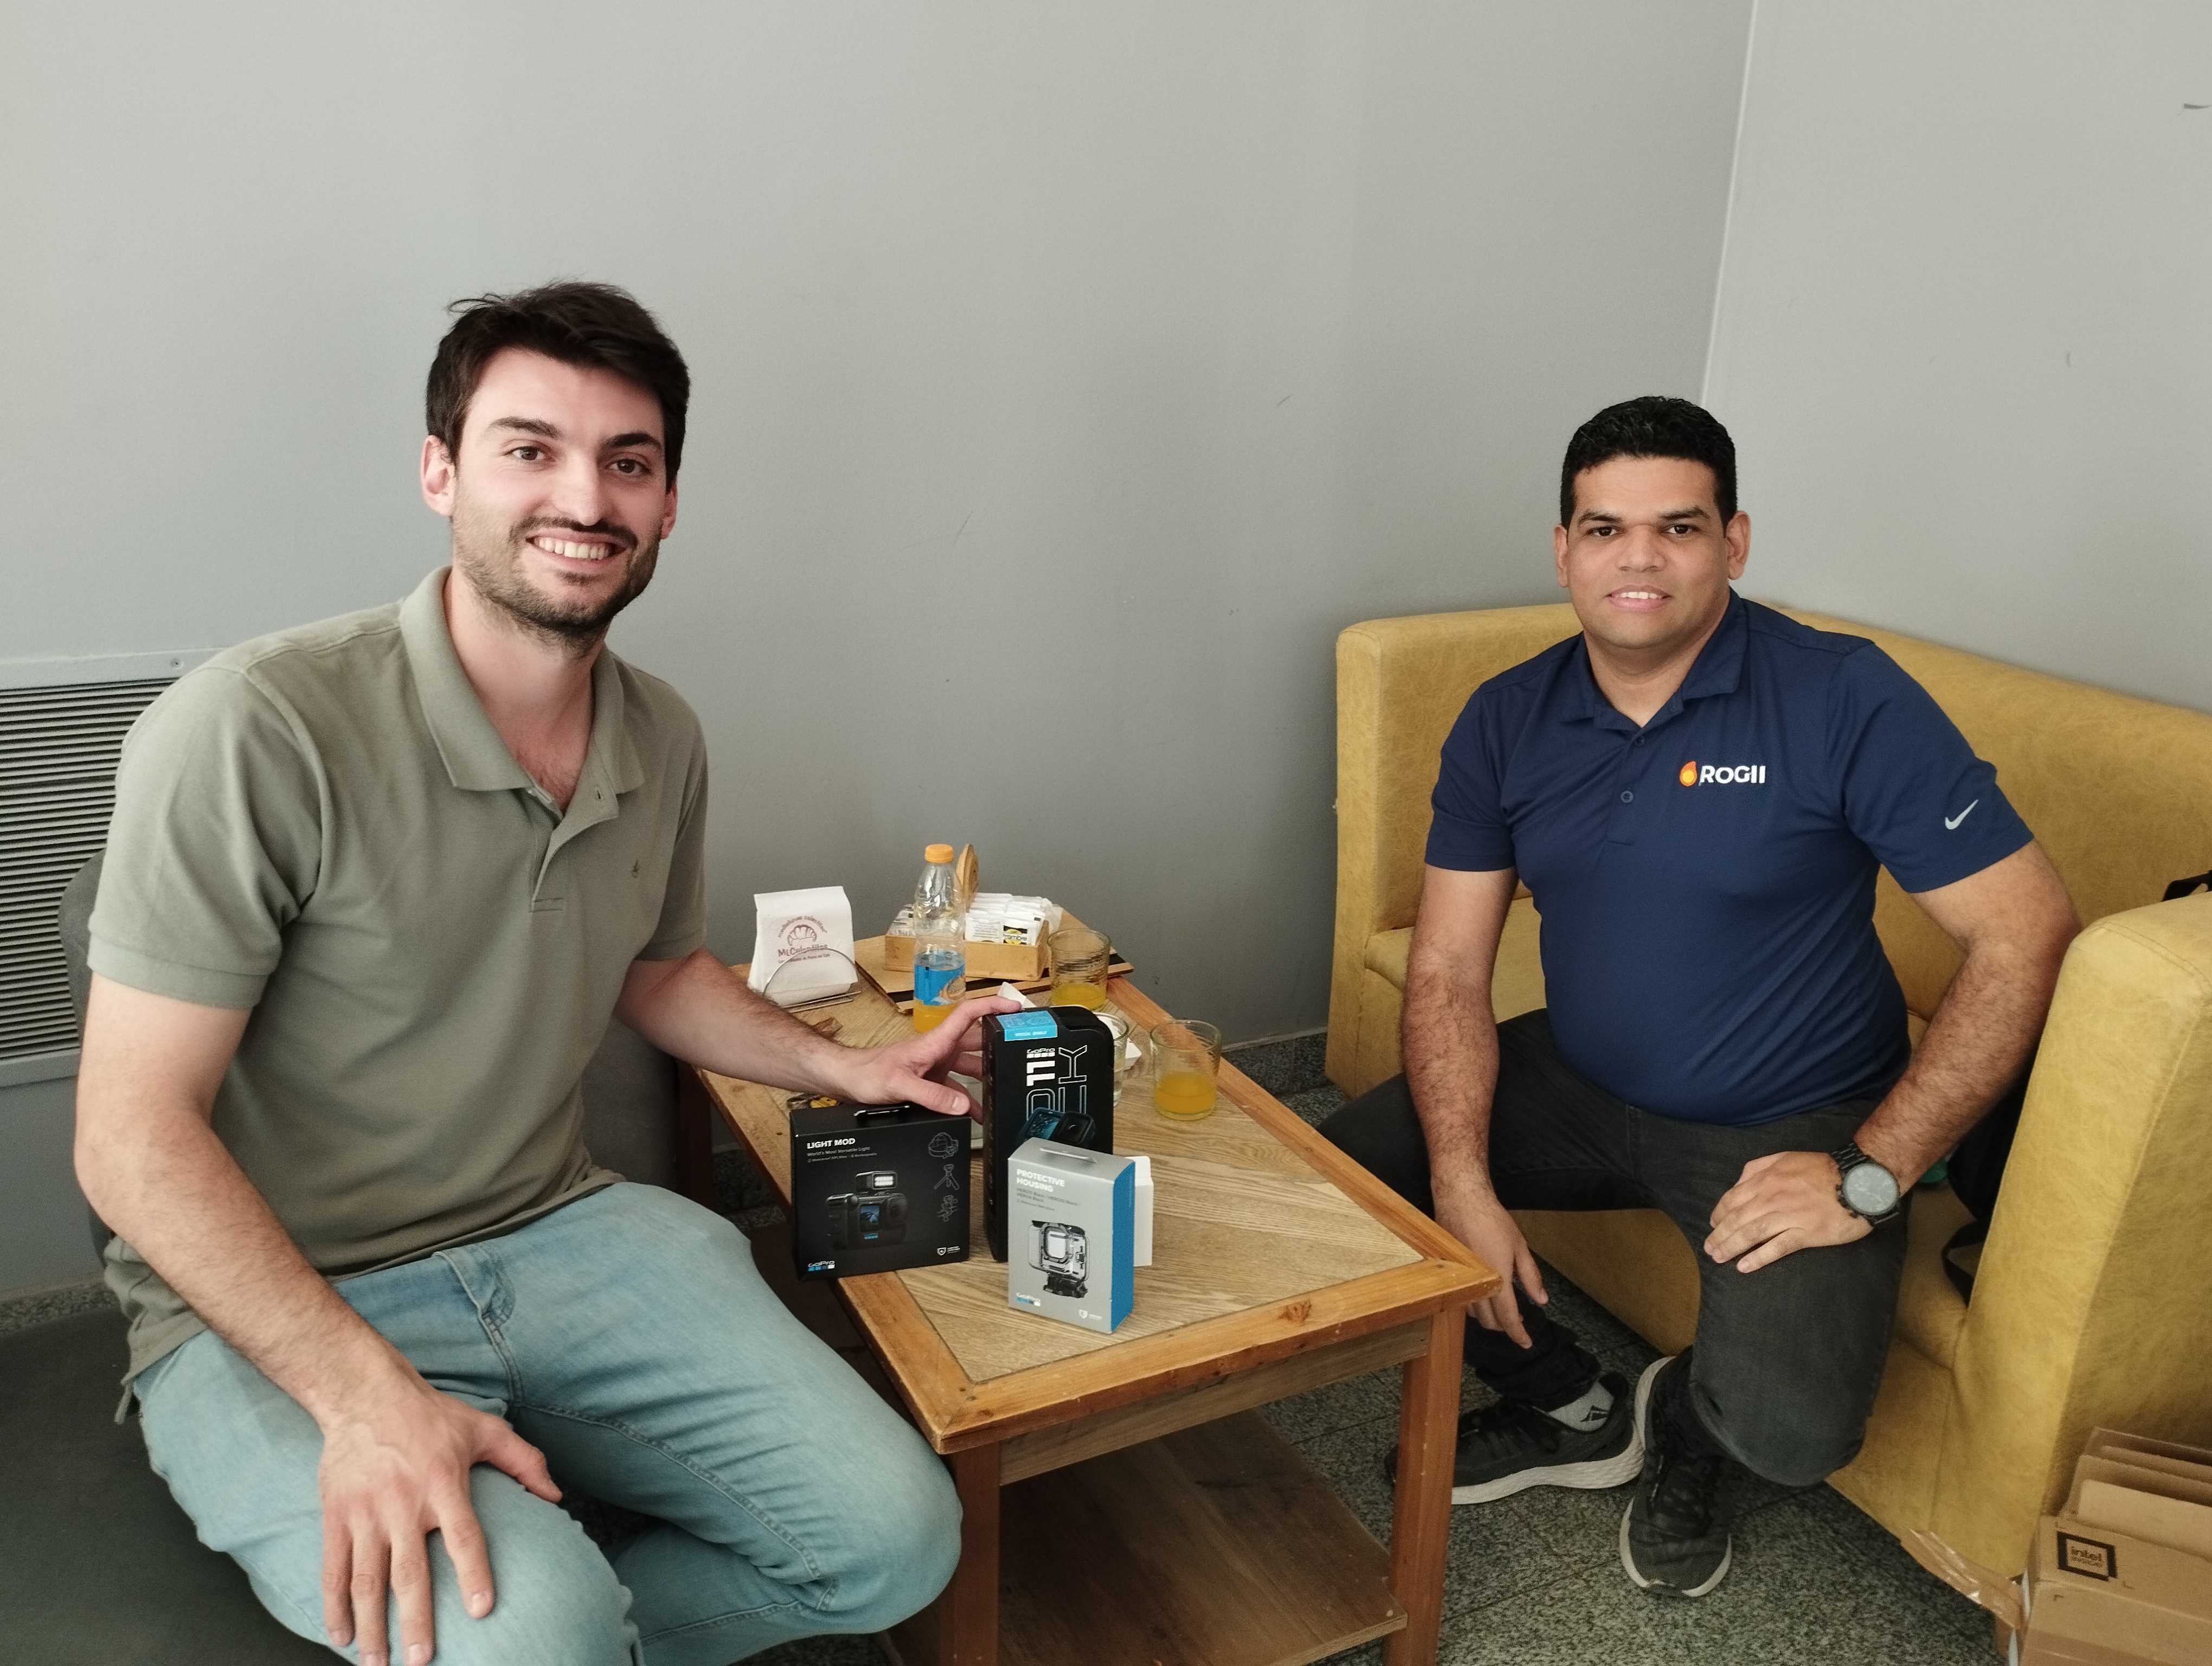
Our latest integration with INNOVA is a game-changing innovation for geosteering operations!
The StarSteer and Innova Well Seeker integration presents a streamlined and efficient solution for collaborative well planning and drilling operations. Beginning with the connection of Well Seeker to the Solo Cloud database and then linking it to the active project in StarSteer, users benefit from a real-time, bidirectional exchange of critical information. Starring a target line in StarSteer triggers instantaneous transmission of data to Well Seeker, where the data is utilized to generate a offset plan for the directional driller. This plan is promptly sent back to StarSteer in real-time, facilitating seamless collaboration and enhancing decision-making capabilities.
Key Benefits:
This integration marks a significant step forward in streamlining your geosteering workflows, providing you with the tools to make more informed decisions and ultimately improve operational outcomes.

The 2023 Geosteering World Cup brought geologists together from all over the world, in a way conferences and water coolers cannot... to compete to earn the title and become the Geosteering Champions of the World! We'd like to congratulate and honor this year's champions 🎉
.jpg)
.jpg)


¡Hola desde Madrid! We want to express our gratitude to all who made AAPG Ice event a success!
It was truly a pleasure reconnecting with familiar faces, forging new connections, and showcasing our latest innovations to such an engaged audience. The live demos at our booth were a highlight, and we appreciate everyone who stopped by to experience our solutions in action.
Until next time, muchas gracias for a wonderful time at AAPG Ice 2023! ¡Hasta pronto! 👋


The past week was a remarkable adventure at ADIPEC, filled with the thrill of making fresh connections, reconnecting with our clients, and exchanging priceless knowledge. A special shoutout to all those who graced us with their presence. Your visit enhanced our journey, and as we wrap up this chapter, we're fueled with the spirit of innovation and collaboration. Stay tuned for what's to come, as we strive to continually redefine the possibilities in the energy landscape!

.jpg)
.jpg)
.jpg)


Every year, the excitement surrounding ROGII's Geosteering World Cup continues to surge! We were thrilled to have over 300 registrations from around the globe, all aiming for the coveted GWC Championship title. After an intense competition, Phillip Szymcek emerged as the ultimate victor, proudly securing the Geosteering World Cup Champion title for 2023!

On behalf of the entire ROGII team, we extend our heartfelt gratitude to all participants who made this event a resounding success, along with our invaluable sponsors. A special shoutout to our Platinum Sponsors – GeoVision, Core Geologic, Edge Systems, and MOJO – for their unwavering support. Your dedication truly makes the Geosteering World Cup what it is today.
We also want to extend our sincere thanks to our exceptional hosts: Adam Martin, co-hosts Robert Gilmore; our talented producer Michael Bodack; and our esteemed guest speakers, Trey Sessums, Kory Wiley, John Boswell, and Pavel Dorofeev.As we conclude this year's Geosteering World Cup, we look forward with great anticipation to seeing you all next year for an even more exciting and bigger competition!

We'd like to extend a special Thank You to the ADNOC Group, and to all of the participants who attended our first-ever ROGII Tech in Abu Dhabi!
The day was filled with extraordinary presentations on a variety of topics such as geosteering, geoscience, and drilling, as well as case studies on how ROGII improves workflows and is leading the industry by bringing operational efficiency to the next level.
Looking forward to next year!

IMAGE23 ROCKED! Thanks to all who stopped by our booth, allowing us to prove how #ROGII continues to steer you to success. Whether you attended one of our scheduled talks or even caught a glimpse of #DrillSpot, we hope you learned a thing or two. Our team eagerly awaits next year!


TGS and ROGII Inc Announce Strategic Partnership *
HOUSTON, Texas (17 August 2023) – TGS, a global provider of energy data and intelligence, announced today a strategic partnership with ROGII Inc. to jointly provide an integrated solution that allows engineers and geologists to easily access TGS licensed well data within ROGII’s cloud-based platform, Solo Cloud. This will enable customers to quickly identify the right data for their geosteering and well planning workflows.
ROGII Inc. focuses on creating a multi-disciplinary, collaborative environment through Solo Cloud, ensuring geoscientists, drillers, completions engineers and many more can work together in on one centralized dataset. Its intuitive interface, featuring automatic data loading and project synchronization, ensures rapid access to the latest information, minimizing complexity and enhancing productivity.
TGS well data can be accessed within ROGII’s Data Manager application by enabling the TGS wells layer on the map to observe the diversity of the dataset. Logging into the user's respective TGS account provides seamless access to importing data directly into a project within their Solo Cloud account or examining it with the gun barrel plot feature.
Jan Schoolmeesters, EVP of Digital Energy Solutions at TGS, said, "Our partnership with ROGII marks a significant step in enhancing the accessibility and usability of valuable well data for drilling engineers and development geologists. This collaboration aligns seamlessly with TGS's commitment to providing cutting-edge solutions that empower professionals to make smarter, more informed decisions."
Julian Stahl, Vice President of Global Sales at ROGII, said, “We are excited to release this new partnership to our mutual end-users. TGS's extensive, curated well database powered by ROGII's automated, machine learning workflows will take well placement analytics to the next level. We constantly strive to reduce clicks for our users. This seamless, backend database integration will greatly reduce ETL workflows across the geoscience discipline."
With the largest subsurface dataset in the energy industry, TGS uniquely combines unparalleled volumes of quality-controlled well data with proven geological expertise. For more information, visit TGS Well Data online at https://www.tgs.com/well-data-products.
About TGS
TGS provides scientific data and intelligence to companies active in the energy sector. In addition to a global, extensive and diverse energy data library, TGS offers specialized services such as advanced processing and analytics alongside cloud-based data applications and solutions. For more information about our products and services and who we are, visit TGS.com.

*Press release taken from official TGS website
.jpg)
ROGII Tech Houston 2023 is now part of our history. A sincere thank you goes out to our technical presenters who played a pivotal role in making this year's event truly outstanding!
Witnessing firsthand how our clients leverage our solutions to push boundaries through advanced analytical workflows, seamlessly integrating data and operational concepts within the drilling process, has been truly inspiring. We're grateful for the opportunity to collaborate and innovate together!
.jpg)
.jpg)
.jpg)
.jpg)
.jpg)
.jpg)
.jpg)
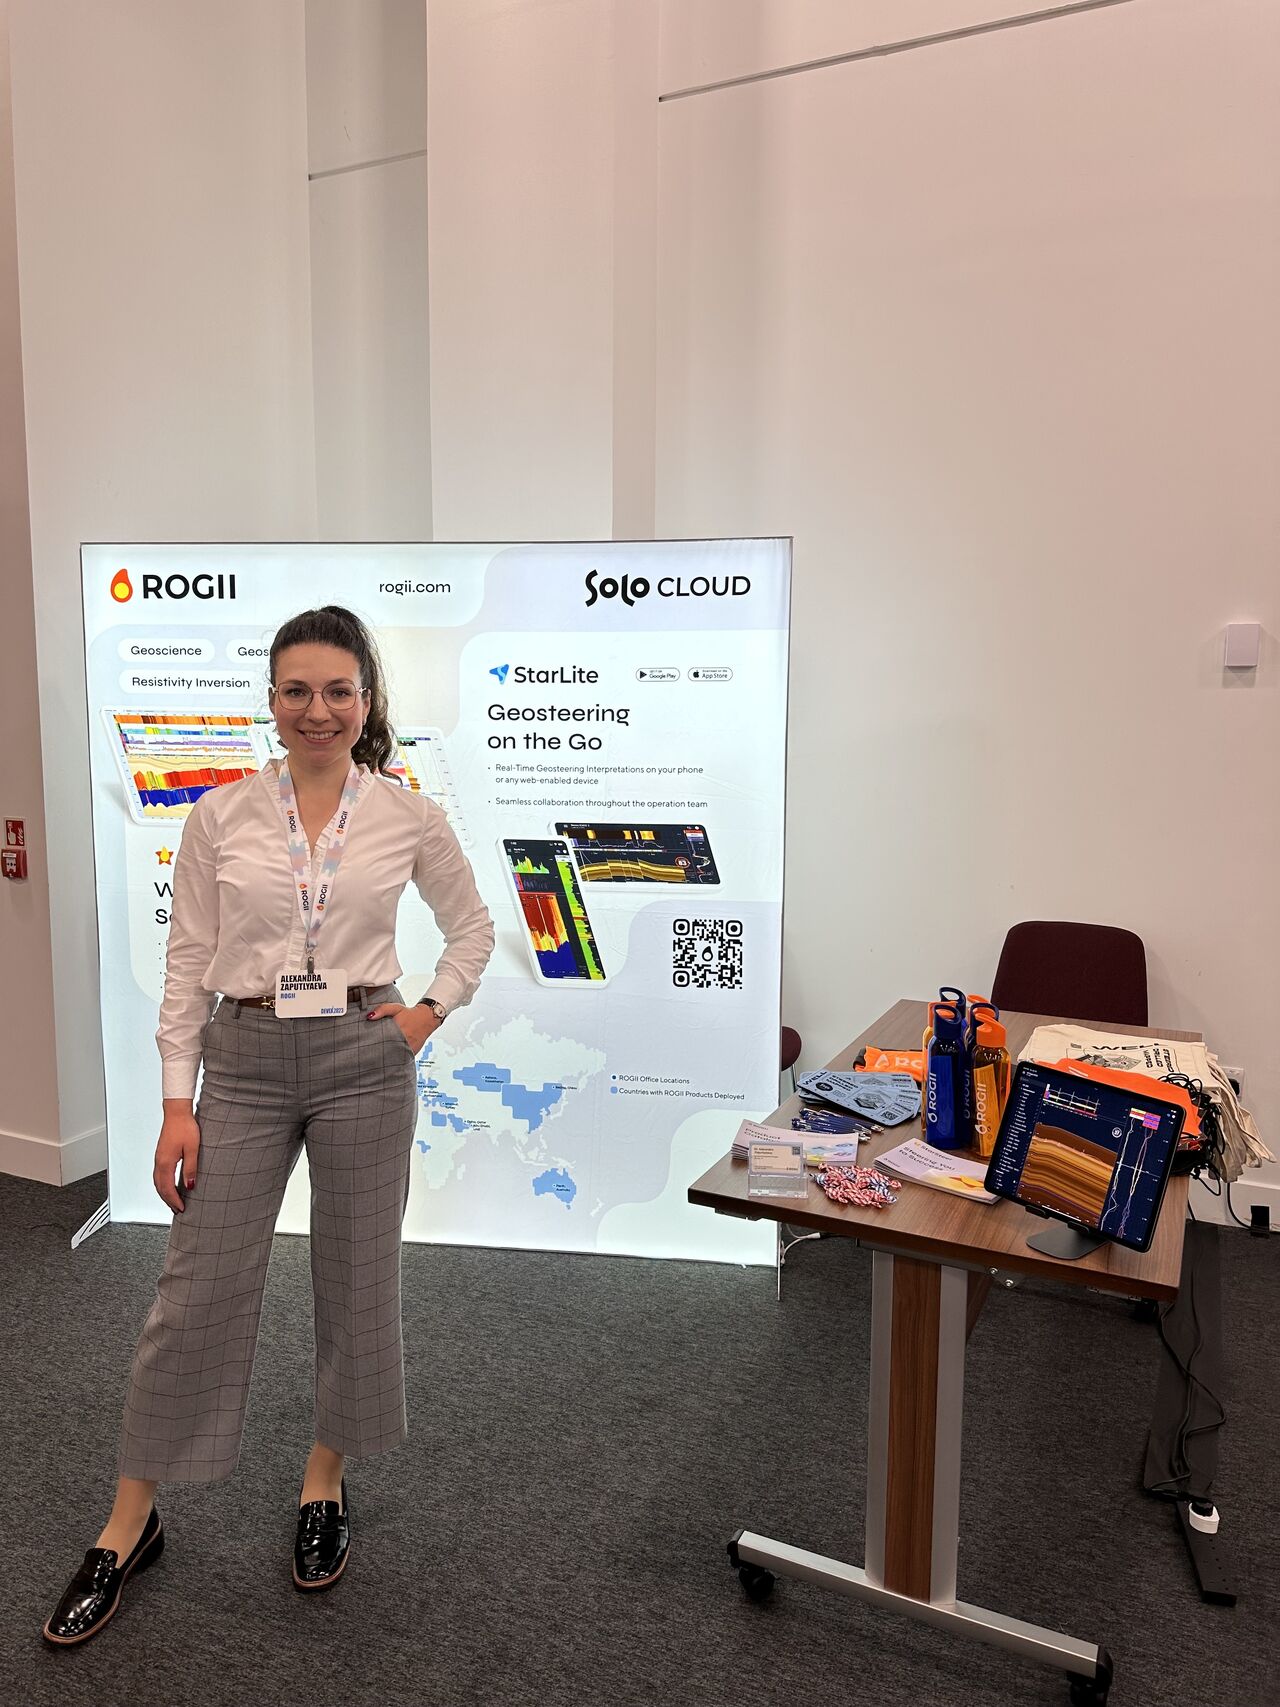
Our Europe Managers Alexandra Zaputlyaeva, PhD and Joanna Hansford attended the 20th DEVEX Conference organized by Society of Petroleum Engineers International in Aberdeen. They presented ROGII's cloud solutions developed for enhancing well placement and optimizing reservoir performance through advanced data analytics, machine learning techniques and high technologies.
Alexandra Zaputlyaeva, PhD was also giving a presentation on the topic: "Geosteering Techniques Integration to optimize well placement. Case studies from the Norwegian Continental Shelf."


Greetings from the EAGE (European Association of Geoscientists and Engineers) Annual Conference in Vienna!
Our colleagues Alexandra Zaputlyaeva, PhD, Joanna Hansford, Romulo Cuevas Hernandez and Julian Stahl are waiting for you at the booth 306 to present our cloud solutions for optimizing and improving well placement.
Stop by to get more information on how our cloud solutions can revolutionize the drilling operations and take your well placement strategies to new heights!


Buenos Aires, Argentina (May 3rd, 2023) - Pan American Energy, the operator, has recently successfully completed the drilling of a horizontal well in the Lindero Atravesado area in Vaca Muerta.
The 3,050-meter lateral section well was landed and geosteered with exceptional precision within a very narrow interval within the Vaca Muerta Formation, utilizing only 3.2 vertical meters of thickness to position the entire horizontal section.
The high-precision geosteering of this well was carried out by PAE's drilling and geology team in conjunction with ROGII Latina's well placement team.
PAE utilizes specialized software combined with collaborative cloud-based technology developed by ROGII to enable 24/7 monitoring, real-time interpretation, and decision-making, supporting effective and timely communication among the specialist teams. In the geological context, the lateral section was drilled along an upward-dipping monocline, ranging from 2.1° to 4.7°, crossing lithology that varied from marls to clayey limestones. Detailed analysis shows that this well achieved 76.2% (over 2,300m) within a mere 1m thickness of the target.
This project is considered a significant milestone due to the ability to meet the proposed objectives set by both drilling and geosciences. The precise placement of the well, while maintaining a high penetration rate (averaging 45m/hour) using a BHA equipped with RSS, allowed the drilling to be completed within the planned timeline.
Because of Solo Cloud and AWS, our clients can work without the risk of losing their data. It is ourgoal at ROGII to provide our clients with state-of-the-art software solutions that they are happy with!
Leo Furch1, Williams Bernay1, Adrián Rasgido2, Guillermo Lopez Pezé2
1.- Rogii Latina;
2.- Pan American Energy.


Yesterday's ROGII Tech event in Qatar, Doha was an absolute blast!
A big thank you to all who attended and contributed to an unforgettable event and huge congrats to the winners of a Geosteering Competition! 🤟🏻
Until next time!


Geosteering training just got a lot hotter in Bakersfield, California - and we're not talking about the weather!
California Resources Corporation knew they were in for a wild ride when these three studs rolled up in their red Dodge Challenger.
Who knows what happened after hours? Let's just hope they remembered to buckle up and avoid any rocky situations - both on and off the road!
ROGII’s Canadian team had a delightful lunch yesterday at Brix & Barrel to commemorate the arrival of new team members and the growth of the Technical team. The occasion was made even more special with the presence of Rachel Grande from our Denver team and William Sessums III from our Houston team, who had traveled all the way to Calgary for team building and training. 2023 is the year of expansion.

Our annual ROGII Tech tour continues!
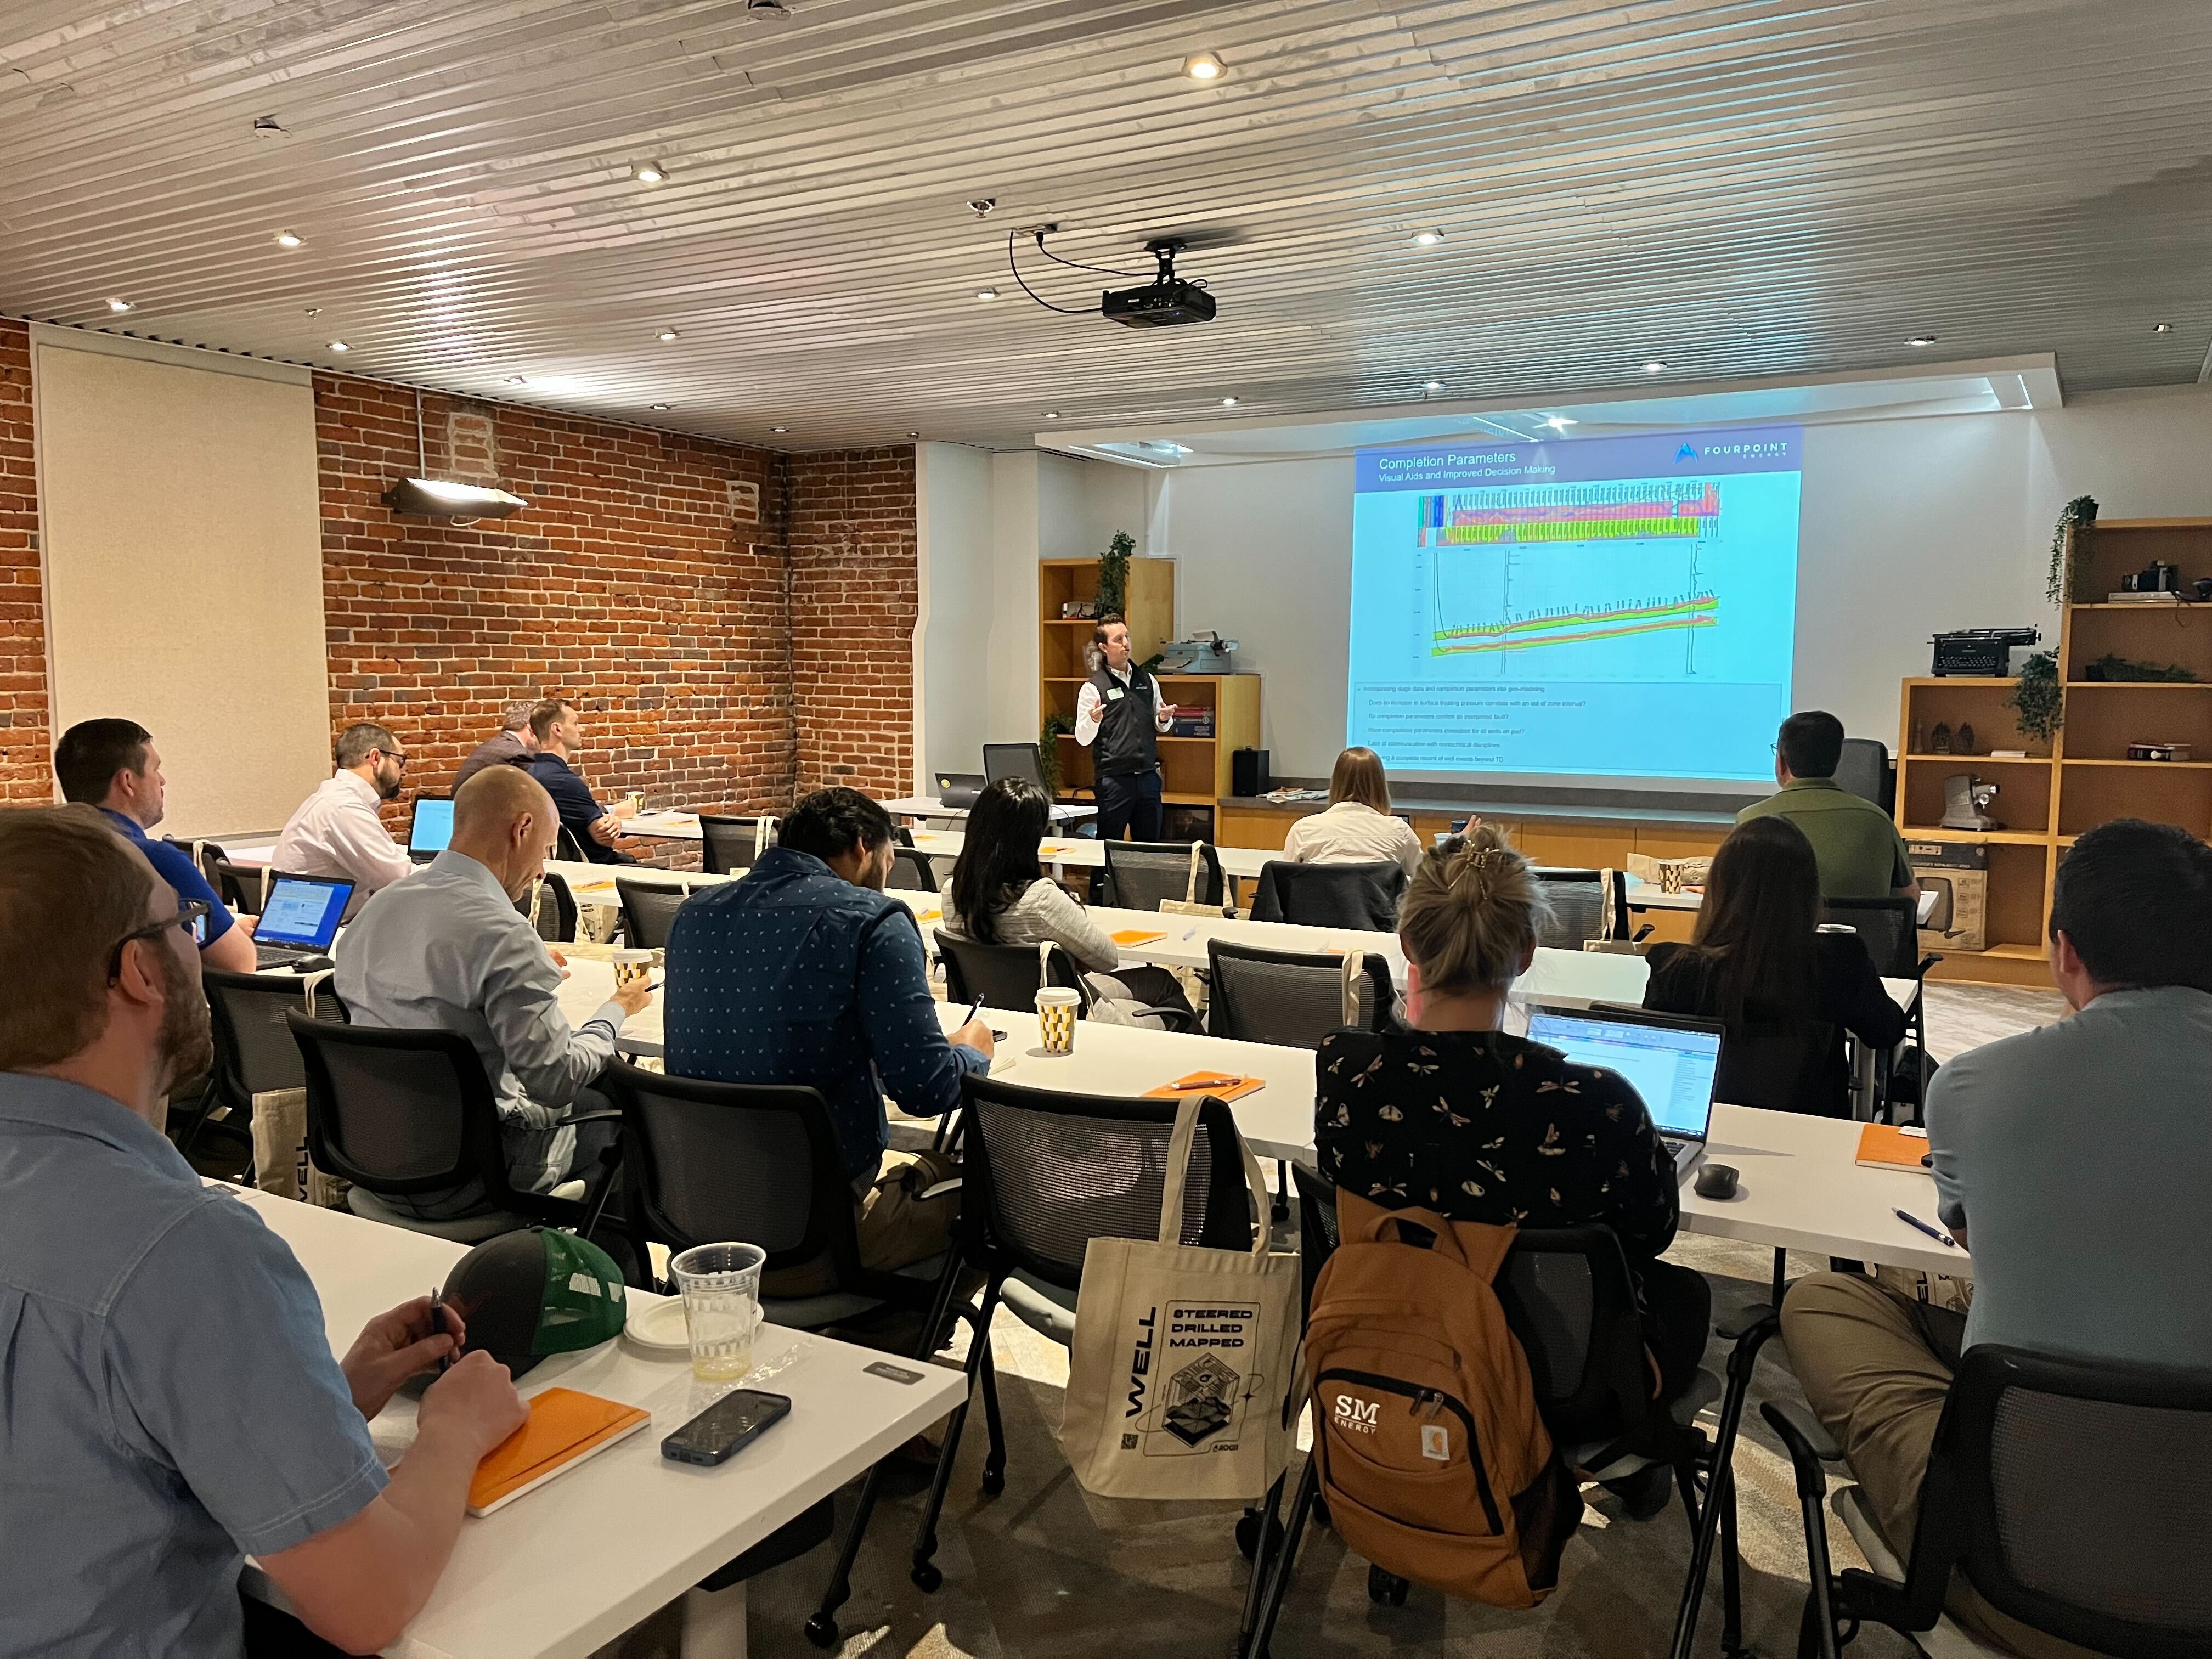
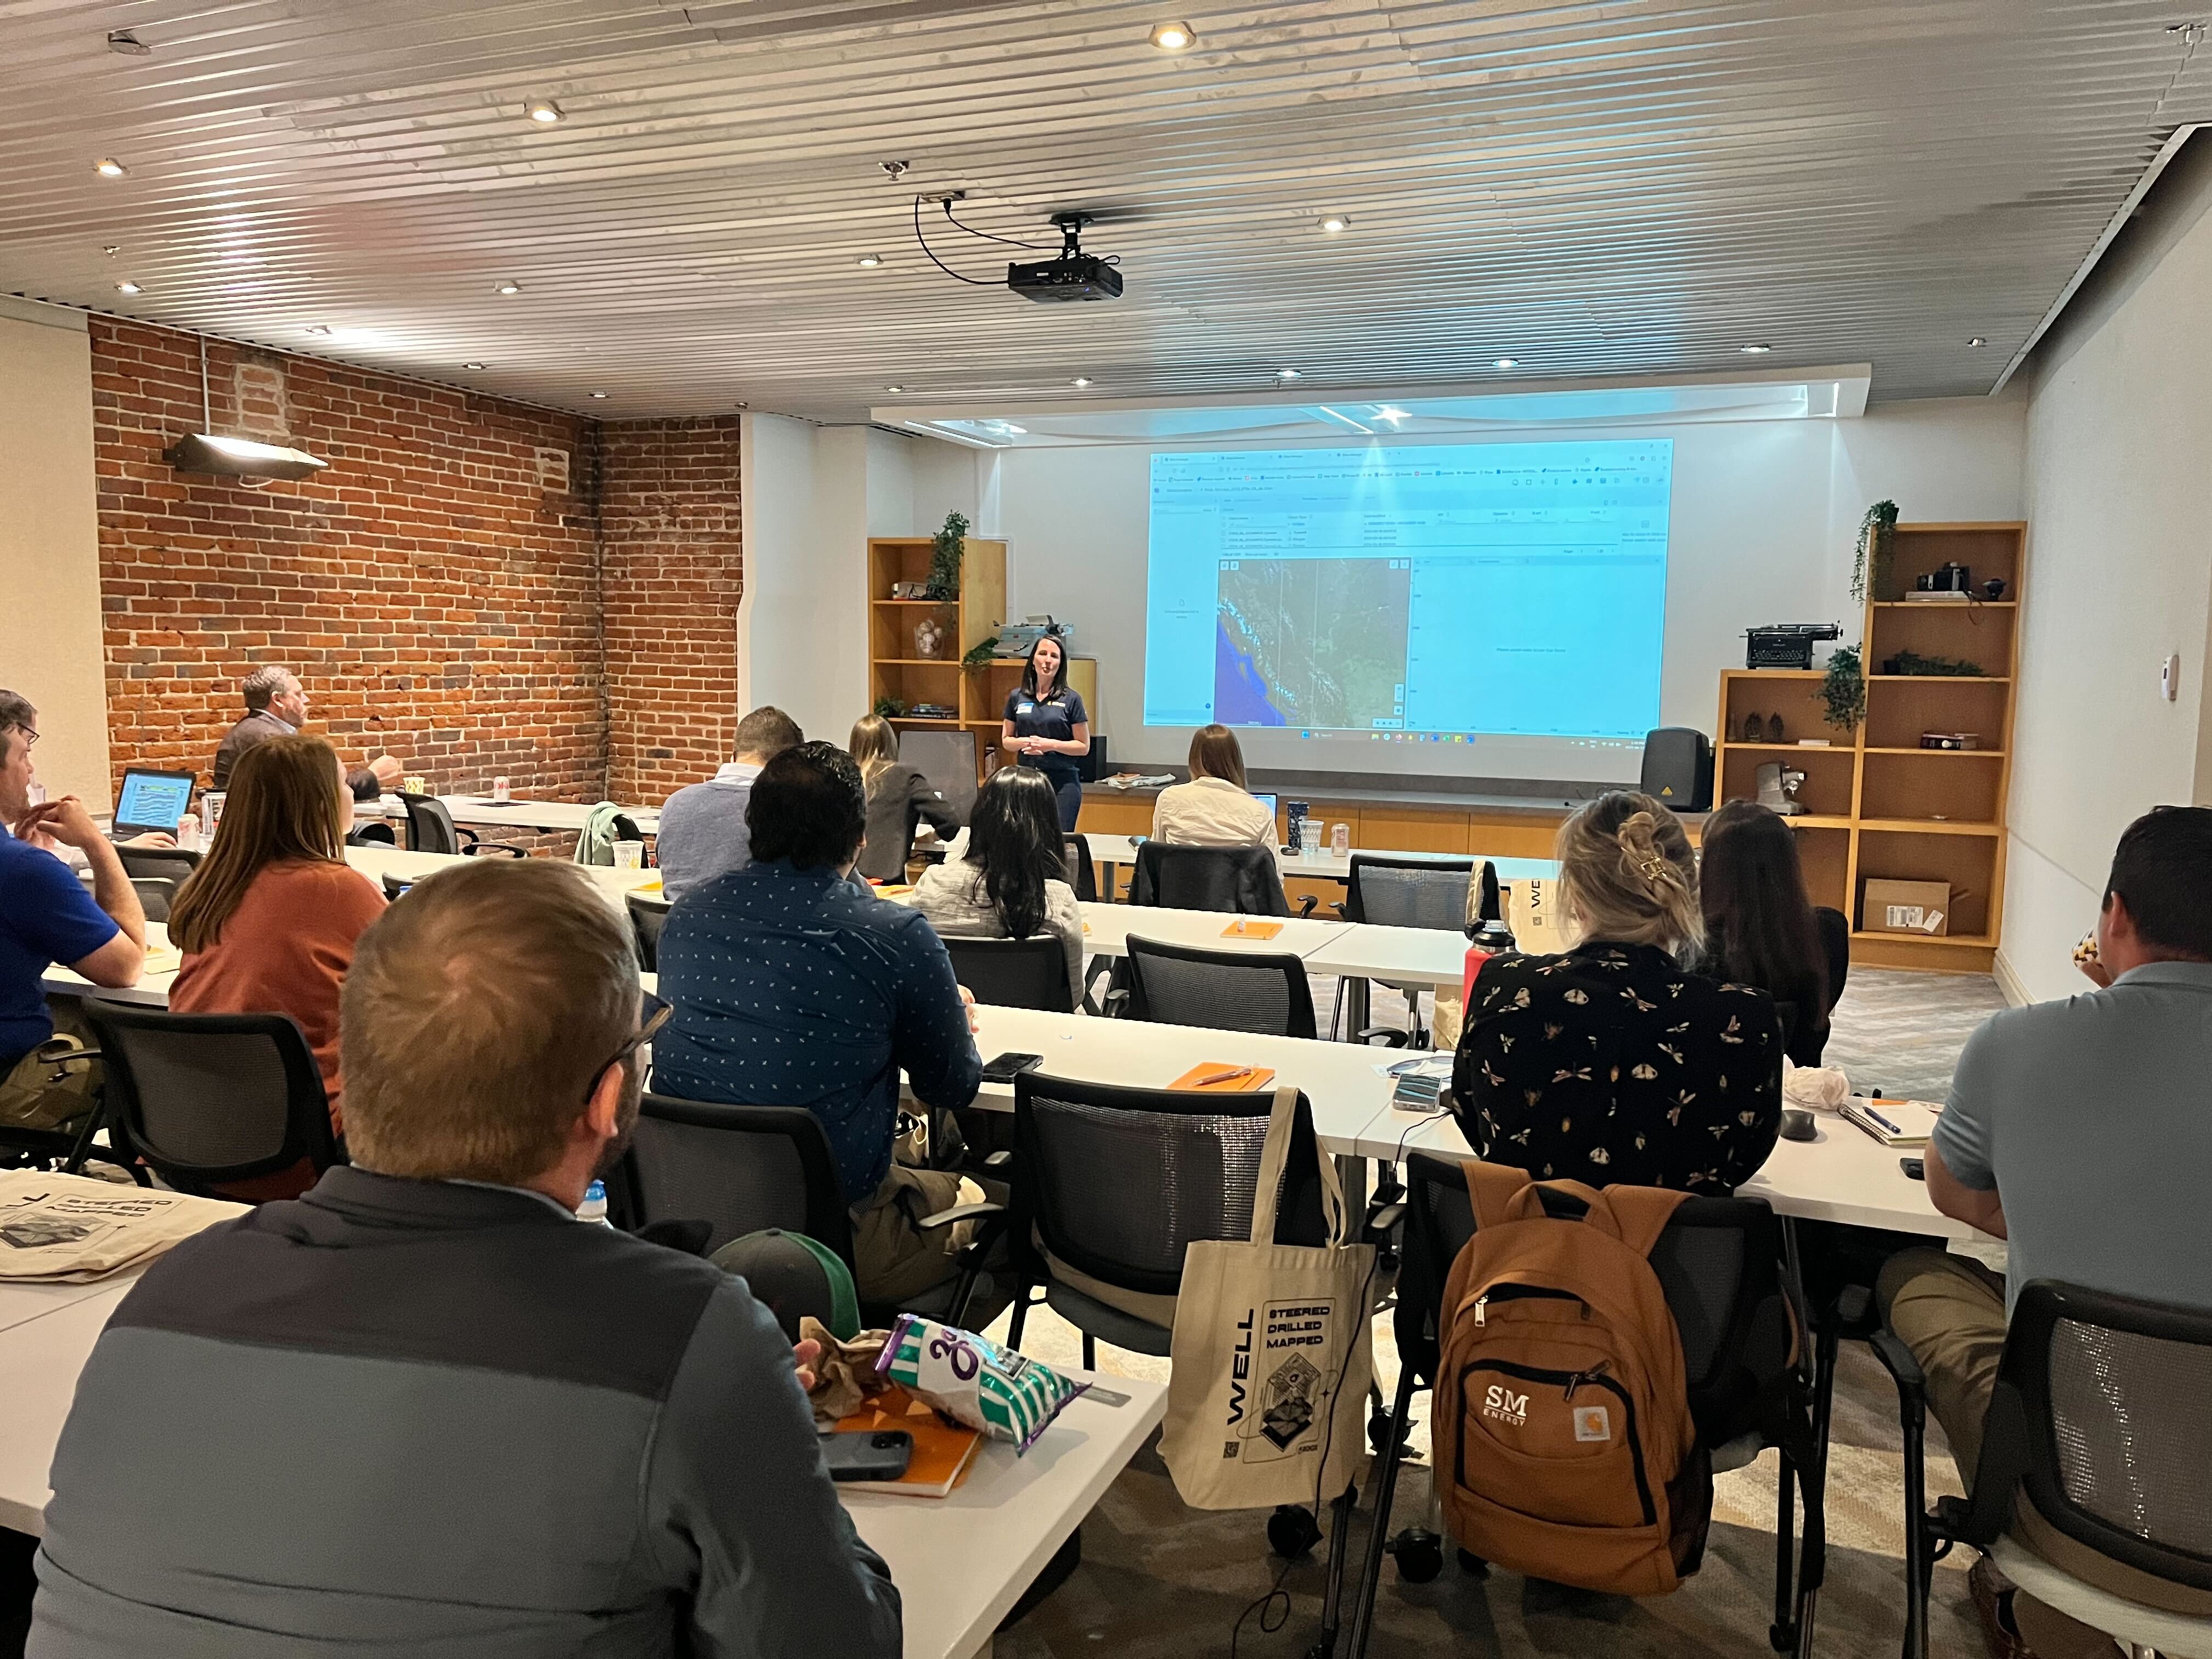
We are extremely happy to announce that the first event in Denver was a blast! We had a fantastic conference with some really great presentations from Ellen Wilcox, Kalen Smith, Teresa McCombs and the ROGII technical team.
Great technical discussions, networking and a happy hour too!Huge congrats to Kajal Nair for winning the Geo-trivia and some Colorado Rockies tickets! 🧢 ⚾Thanks to all who attended!
Shout-out to The Sooner State! Everything is OK in Oklahoma 😉
The results from yesterday's ROGII Tech in Oklahoma City proved that contributions to collaboration are magnificent.
Everyone who presented - rocked it! We hope everyone who attended had as much fun as we did and left feeling inspired and energized.
This was just a taste of what is to come. A special ‘Thank You’ to our guest speakers Keith Cardon, Moe Alsaqi, & Trey Welch for your presentations! We couldn't have done it without you!


The new ROGII Tech series has already started and we are very excited to say that the first event took place in Calgary, Canada!
As our Canada General Manager Janelle Springer said:
"Calgary's Rogii Tech Day was a great success! Nearly 80 StarSteer enthusiasts spent the day sharing ideas, attending workshops and enjoying the happy hour afterwards. It was a blast seeing everyone and getting to catch up.
We're already excited for next year's event!"Thanks to everyone who shared this day with us! Until next time!


We are excited to share our experience from the recent conference EAGE Digital focused on digitalization in the energy industry.
The conference provided an excellent platform for us to engage in stimulating discussions with industry leaders and experts on the latest technologies, state-of-the-art products, and innovative services that are transforming the energy industry.It was a great opportunity to connect with our partners and collaborators, as well as meet new professionals from industry and academia.
We were impressed with the level of knowledge and expertise that attendees brought to the event, and we look forward to continued collaboration and knowledge sharing with them.
Also, we want ot give a huge shout-out to our colleagues Alexandra Zaputlyaeva, PhD and Igor B Uvarov who presented our latest development achievements and gained new connections in the energy industry!


.jpg)

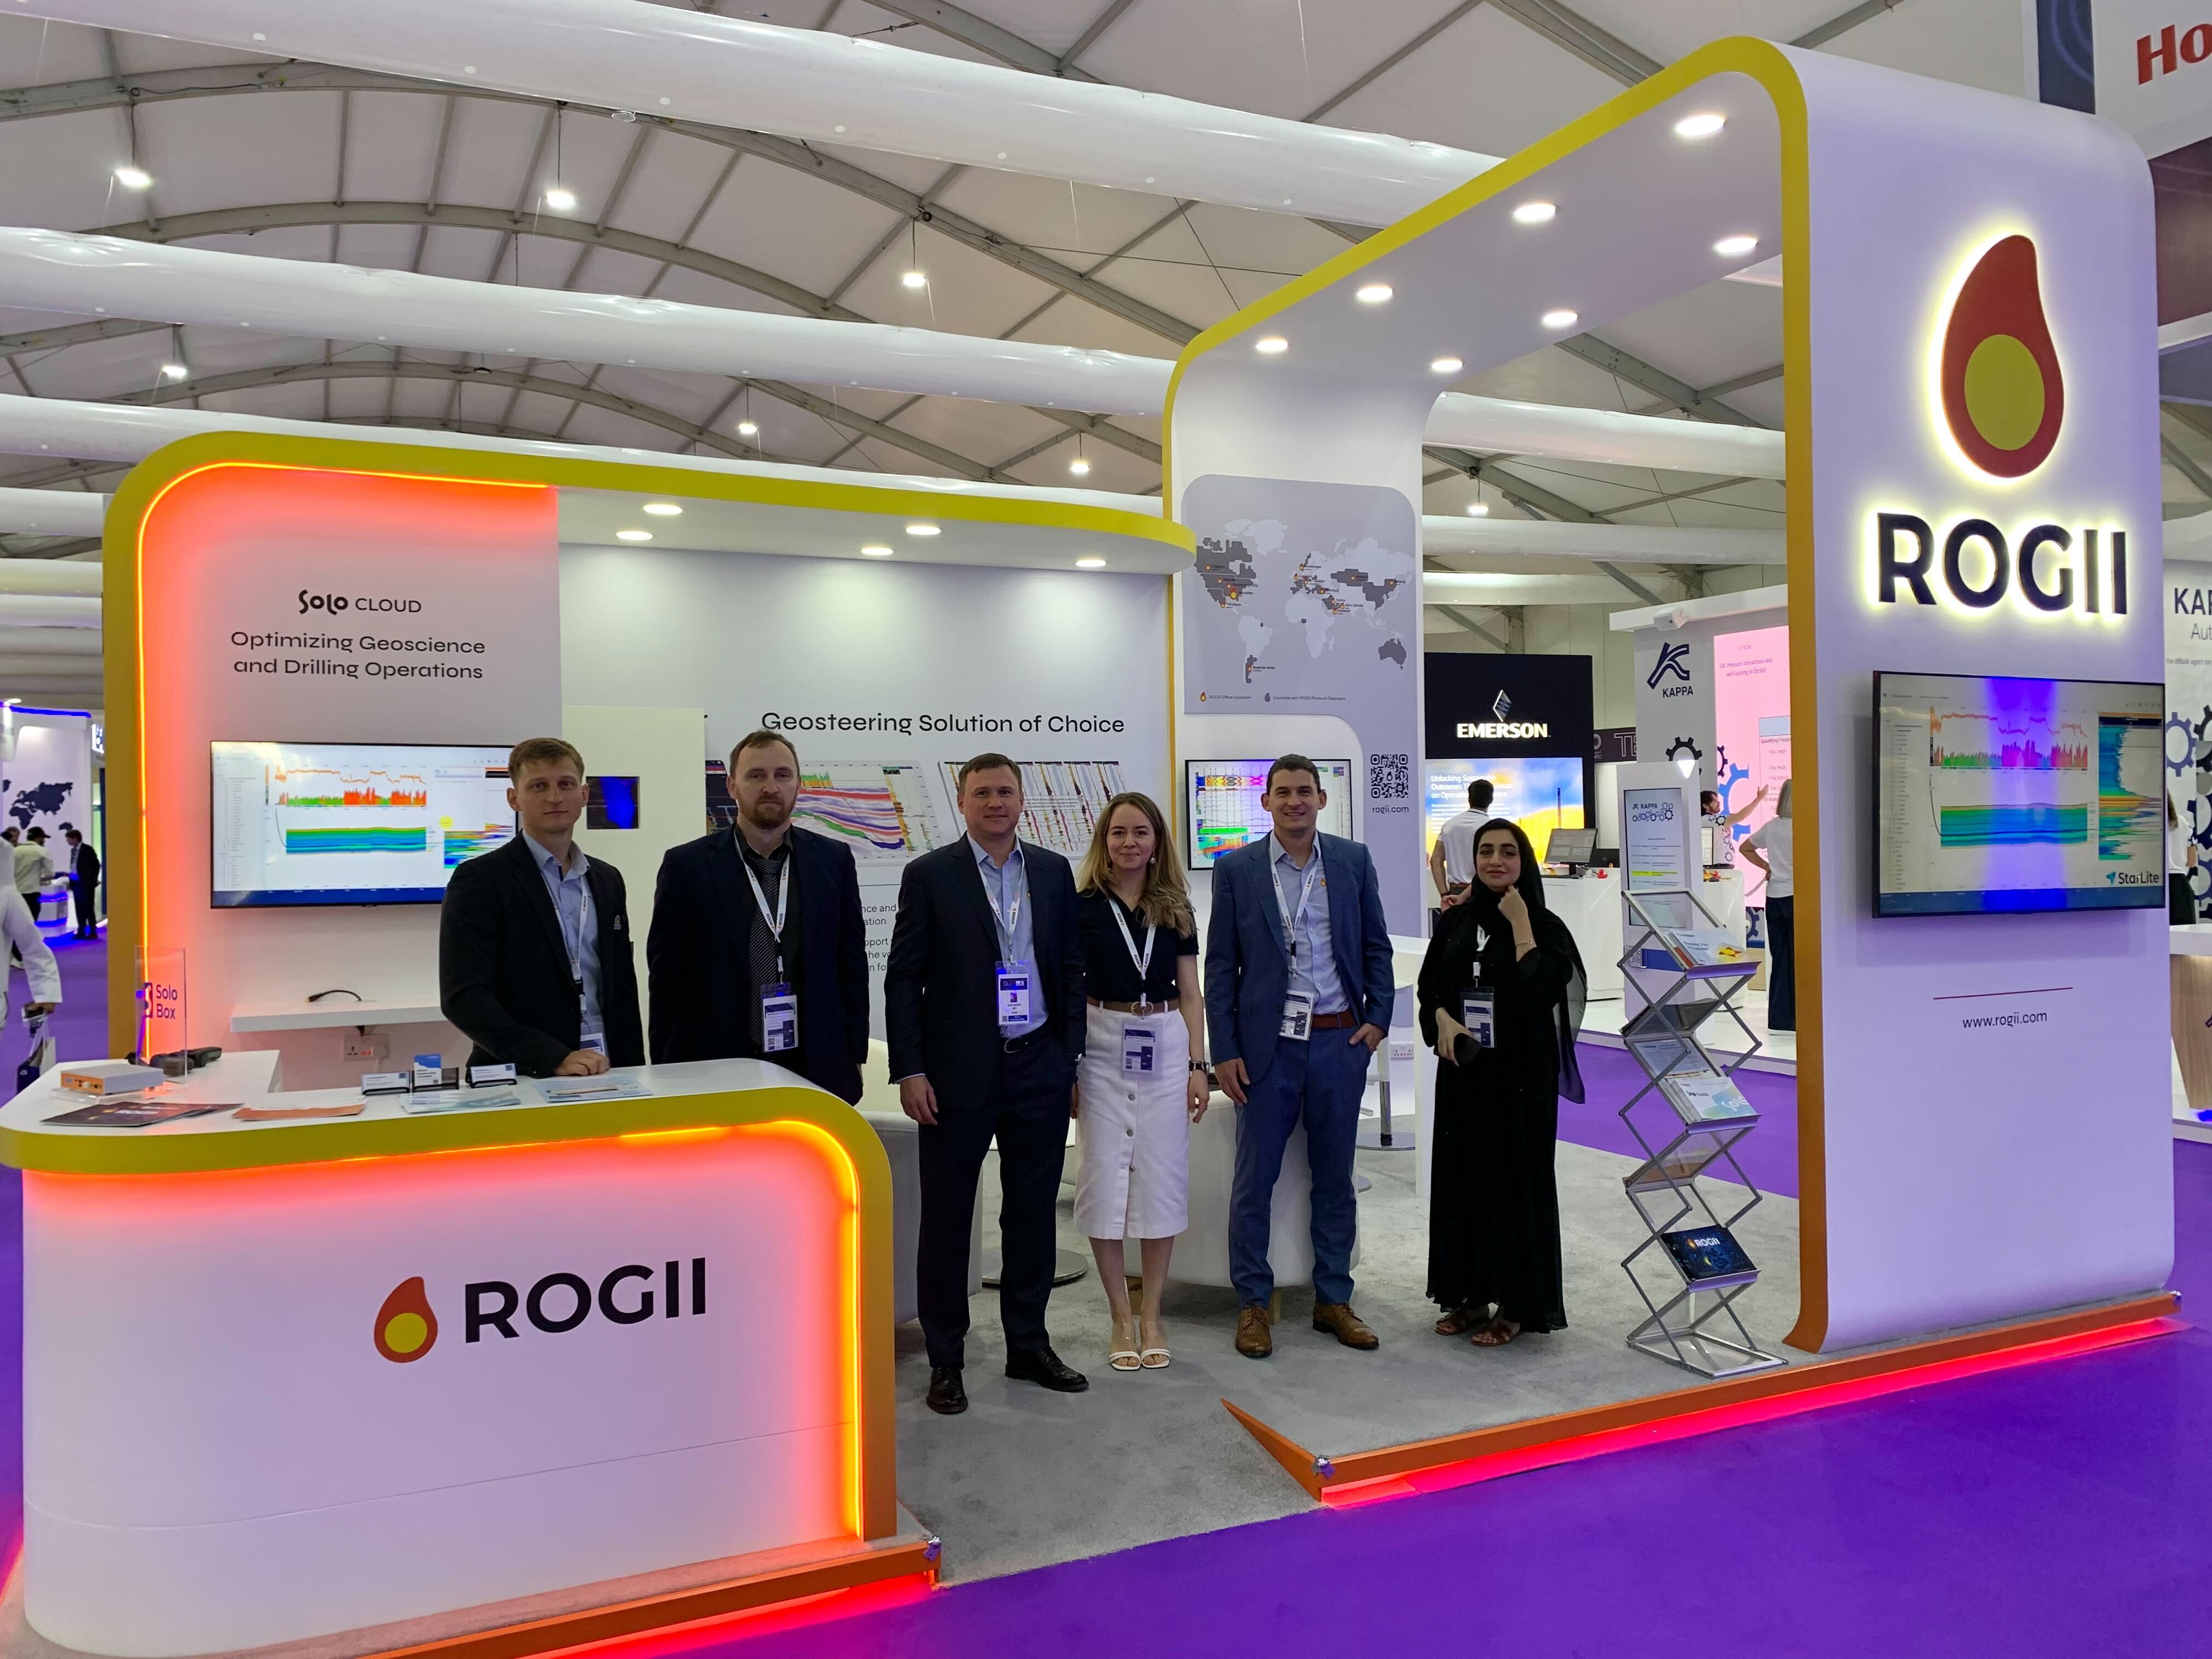
MEOS GEO - Middle East Oil, Gas and Geosciences Show (MEOS GEO) was a great success!
We are so grateful to be a part of such a large event and to exchange great knowledge on workflows in the cloud, geosteering strategies, and the most recent advances of ROGII in technologies and applications for geosciences.
A big shout out to everyone who stopped by our booth, it was a pleasure seeing familiar faces, making new acquaintances and sharing with our audience our latest innovations! Not to mention our solid team represented by Elham Alnadabi, Kirill Ronzhin, Lamri Benmehdi and Dieter Krott.
Great job guys! See you Bahrain! Until next time!


.jpg)
Thanks to everyone who joined our official geology field trip: Winter Park on the Ski-Train!
We had a really great time combining business with pleasure!
See you next time!
.jpg)

It was a pleasure kicking off the Exhibition and Conference season last week at NAPE Expo LP!
Thank you to everyone who caught us on the floor as it was great catching up, connecting, and forming new relationships.


We had a great time last week on a Technical Session in Malaysia held by the help of our partner - Integrated GGRE Asia Sdn Bhd!
Thank you to all attendees for participating, and a huge shout out to our geosteering lead - Danil Nemushchenko for sharing his vast knowledge on steering wells!
Looking forward to seeing you again!

Solo WITSML™ Store is now certified by Energistics against the requirements for WITSML™ v1.4.1.1!
This certification benefits both our end-users and us as the WITSML™ server vendor. It adds enhanced interoperability between deployed solutions and helps streamline development using the Testing Tool provided by Energistics.
Also, the expertise gained during the development of Solo WITSML™ Store has positively influenced StarSteer and Solo Feed products, making them even more seamless when it comes to WITSML™ streaming.

#CONEXPLO 2022 in Mendoza, Argentina was a great success!
We are so grateful to be apart of such a large event and to exchange great knowledge on workflows in the cloud, geosteering strategies, and the most recent advances of ROGII in technologies and applications for geosciences.
Our very own Rafael Aguilar and Angela Rodrigues had a great time, making new acquaintances,gainig new knowledge!
We hope to see you all again next year!


We are proud and excited to introduce our latest update for Data Manager!
Users can now use the Gun Barrel tool and check out the updated user interface!
With Gun Barrel, you have a powerful well spacing visualization tool, and can display your wells in a 2D vertical cross-sectional view, as well as calculating distances on the fly using the handy ruler tool.
To learn more about Data Manager features or to get a trial, please reach out to your region’s account executive!

We would like to especially congratulate AIRAT SABIROV our 2022 Middle East, Asia Geosteering World Champion.
From everyone at ROGII, thank you for participating and we hope you enjoy your drone!
.png)
Great days we had in Stavanger, Norway at the 2nd Geosteering & Formation Evaluation Workshop by NFES and NORSE.
It was a pleasure presenting different case studies using our very own Resisitivity Module. Danil Nemushchenko did a fantastic job presenting in front of almost 100 people!

Houston, Texas (November 5, 2022)
A large operator in Houston deployed ROGII’s Solo Cloud three years ago in one of their many asset teams to evaluate collaborative, cloud-based workflows for their geologic operations team. Solo Cloud is hosted on Amazon Web Services with complete disaster recovery and business continuity protocols audited annually by the accredited SOC 2 Type 2 certification process.
Changing existing workflows in large operators, especially for real-time operations where any mistake can cost millions, is always a difficult task. However, the operator realized that their existing workflows,communication and data storage mechanisms had reached the limits and had great potential to be optimized through evolving cloud solutions and technology. Their introduction of Solo Cloud was largely focused on streamlining communication and data flow.
Prior to deploying Solo Cloud, typical communication mechanisms revolved around emails, PDFs, Microsoft Teams Messaging, WhatsApp,SMS and more. These channels of communication came into existence organicall yover many years. With increasing rigs, the operator realized that bits and pieces of information were scattered across multiple platforms that were not queryable, secure, archivable and ultimately not centrally manageable.
While drilling, real-time data was being streamed from the rig into cloud based WITSML servers to be distributed to the various end user sat the operator office. However, the data ended up in individual projects stored locally on the operator’s disk space. Multiple rigs could be within the same square mile and yet, data still was siloed into individual projects on users’ computer.
The operator realized the potential in centralizing all data in one cloud location, enabling true, real-time collaborative interpretation workflows with mobile and web apps for seamless communication with all stakeholders.
After implementing Solo Cloud, real-time WITSML data was streamed directly into Solo Cloud’s series of databases (PostgreSQL, S3,ClickHouse and more). The data is instantly available to multiple operations geologist and drillers with advanced conflict resolution if a single dataset is edited simultaneously by multiple users. This collaborative environment drastically cut down on manual PDF reports, long phone calls and messaging threads. Communication was centralized through ROGII’s native cloud apps.Geologist, drillers, service companies, and managers were all able to view the same dataset from their computer, web browser, or native phone app ensuring that hazards are avoided in a timely manner.
Since the implementation in the single asset, the operator now has standardized all their assets’ drilling operation workflows in Solo Cloud. The data is centrally managed with full decision and change logs readilyavailable. Furthermore, the operator has direct access to their large volume ofdata in 3rd party analytical solutions like Spotfire and PowerBI for customized analytics through API and PythonSDK connections.

StarSteer 2022.2 includes a new seismic module with the ability to upload data in SEG-Y format via Solo Cloud.
• Users can now load 3D,depth-converted seismic volumes into Solo Cloud for display in Starsteer
• Drag’n’Drop toload large SEGY files with ease
• Seismic data is compressed to workseamlessly on the cloud with OpenVDSLibrary
• Seismic slices are projected usingthe same functionality as grids:
- along well trajectory
- along VS azimuth plane
- both VS and THL scale
Each user can now use seismic and build geosteering models within one software package that can:
1. Eliminate the need to use multiple software programs for processing heterogeneous information
2. Assess lithology and the nature of reservoir dips concurrent with geosteering the well
3. Expedite the decision-making process for adjusting the direction while drilling wells

Today marked the day at ADIPEC Exhibition and Conference!
A big shout out to everyone who stopped by our booth as we could feel the excitement in the air by the nonstop activity!
It was a pleasure seeing familiar faces, making new acquaintances and sharing with our audience our latest innovations.
Until next time!
.jpg)

We had a great time at Society of Petrophysicists and Well Log Analysts (SPWLA)'s Golf Tournament! New acquaintances, impressions and a great communication!
Thanks to those that stopped by ROGII's tent and Beer-mobile!
We had a blasts seeing some new and familiar faces!


Dallas, Texas (October 28th, 2022)
A Dallas,TX-based operator is deploying ROGII technology hosted on Amazon Web Services’ (AWS) cloud service. Using several SoloCloud-connected applications, the operator can simultaneously stream live data in from many geographically remote field locations, view and interpret the data, broadcast project updates onto mobile devices in real time, and make available the data to other company domains for further analysis as well as other internal software applications. All the while, the data stays 2-way encrypted while in transit and redundancy is minimalized.
At the rig site while drilling, live surface and downhole data is collected and aggregated via ROGII’s Solo Box service. With Solo Box, the operator creates formatting schemas that execute automatically when new data is received. This ensures that only clean, formatted, and quality checked wellsite data reaches ROGII’s WTSML Server hosted on AWS, which maintains a 99.998% uptime reliability. The clean data is then streamed from the WITSML Server to the operator’s AWS-hosted Solo Cloud database account via the Solo Feed connector. Solo Cloud will then update various projects across several applications, and govern access based off an individual user’s assigned permissions.
The operator uses several licenses of ROGII’s StarSteer, a locally installed geosteering application, to interpret their data and confirm ideal well placement. For contingency and business continuity, they maintain one SaaS StarSteer license, utilizing an AWS Virtual Machine. Any updates to projects by any one of the authorized StarSteer users are automatically pushed up to Solo Cloud and communicated to all other users in real-time, ensuring that there is only one version of the project and no data redundancies. While the operator maintains a central real-time operating center, they also augment their staff with 3rd-party consultants. Through a series of permission controls, they authorize the consultants to operate a small project subset without needing to grant access to the entire project, while still being able to maintain real-time oversight.
For internal communications outside of the technical staff,the operator utilizes ROGII’s StarLite iOS mobile application to broadcast geosteering interpretation updates to field personnel as well as to various managerial levels. StarLite connectsusers to Solo Cloud and provides a complete view of a StarSteer project. From their mobile devices, StarLite usersaccess real-time geosteering performance statistics in lieu of static PDF reports.
The operator also maintains a team dedicated to drilling optimization and has developed an in-house, proprietary application to achieve their goals. To incorporate the geological and geophysical data into their optimization models, the operator has chosen to integrate ROGII’s Solo API into their in-house application, which allows them to tap into their Solo Cloud database and stream pertinent data into their application for further analysis.
Starting as raw measurement data point on location, datamakes its return to the rig as an actionable drilling optimization solution for the operator. A network of various ROGII hardware, software and cloud products, all connected on AWS, make the workflow possible.

Please take a moment to congratulate our Latin America regional Geosteering World Cup 2022 winner, Jesús Ezequiel Silva. 🏆️
We had one of ROGII's very own, Franco Serio hand deliver the prize to Jesus!Thank you for competing!
We hope to see you next year 💥

Denver, Colorado (October 21st, 2022)
SoloCloud services, hosted on AWS, have been an absolute game changer when it comes to efficiency in our workflows and collaboration within our organization. Just like most Oil and Gas operators, we have put a high priority toward data integration across domains and better well economics through efficiency. We have seen tangible results toward these goals by implementing ROGII’s Solo Cloud service from beginning to end.
While geologists are the primary data source for information in the cloud, high resolution drilling data and is an integral part of a successful geosteering effort. The geologists work with the drilling engineersto stay as close as possible to the well plan while also staying in the highestquality rock. This collaboration is made much easier with the use of cloudtechnology. Geologists and engineers are accessing the same data in real timeand can make split second decisions that would otherwise take hours or daysusing traditional workflows.
Additionally, a horizontal oil well in unconventional reservoirs is typically not “finished” until it is hydraulically fractured. Hydraulic fracture designs can be optimized with the input of geological data. The geological interpretations stored in the cloud can be easily leveraged by the completions engineer to improve the designs and, ultimately, make a better well. Again, in the past the geological data was either inaccessible or too difficultto use. Now, we can make wells that produce more oil for a longer period. As a business, these improvements have made a significant positive impact on our bottom line. The investment in Solo Cloud technology has been a huge success.

Houston, Texas (October 20th, 2022).
ROGII has an innate ability to identify tomorrow’s problems and address them today. Before the oil and gas industry identified the need to increase collaboration, ROGII was working on a solution that would break down the walls and change the game for operators. It didn’t take long for clients, like Paloma Resources, LLC, to grasp the value of SoloCloud (powered by AWS) and deploy it for their drilling operations.
Harrison Ohls,Geologist at Paloma Resources, LLC states “ROGII’s Solo Cloud has been incredibly helpful for our operations geology team. Before Solo Cloud, our team had to spend time sending data and projects back and forth between users, which required many steps to format and compress the data properly. With Solo, we now have easy access to a single project in the cloud. The flow of data between all geologists working on a project is seamless and instantaneous, allowing for different users to compare their ideas and interpretations with others.”
Harrison touches on another very important aspect of Solo Cloud aside from collaboration and that is the data being stored in a single database. Not only is Solo Cloud breaking down the walls for colleagues to collaborate, but their data is now integrated as well. This opens the door far beyond the immediate task at hand by allowing corporations to look at all of the data together to identify trends they may not have identified before.
Harrison continues, “SoloCloud has been helpful in unexpected areas as well. For example, our IT group needs to make constant adjustments and upgrades to our office computer network,which requires a network shutdown. In the past, because our StarSteer project was stored on that network, we would have to coordinate IT’s maintenance withour operations. This downtime was inefficient and could potentially contribute to an issue with drilling. Now that everything is on the cloud with AWS, this is no longer an issue.”
Based in Houston, TX,Paloma Resources is not new to hurricanes or flooding. “This inclement weather can cause power outages at our offices and shut down our network. Before ourdata was on the cloud, we were always at risk of losing our data access during these storms; if this happened while drilling a well, it could be disastrous. It’s one extra reason why we are glad we made the switch to Solo,” continues Harrison.
Because of Solo Cloud and AWS, our clients can work without the risk of losing their data. It is ourgoal at ROGII to provide our clients with state-of-the-art software solutions that they are happy with. “We couldn’t be happier with our upgrade to StarSteer and Solo Cloud and suggest that anyone debating about making the switch to go ahead and make the plunge. It’s worth it,” confirms Harrison.

We are happy to announce our collaboration with PetroNinja! Public data base integration with Petro Ninja now live on Solo Cloud!
Seamlessly upload well data directly into your Solo organization and access it right away!
What you can do?
Reach out to your regional Account Executives to learn more!

HOUSTON, TX (September 28th,2022)
Every year, ROGII conducts a global geosteering competition called the Geosteering World Cup, where experts in the field of geosteering compete to be the best in the world and be crowned the champion. In this competition, all participants drill their own well through a pre-defined 3-dimensional geologic model, receiving simulated data in real-time at consistent increments. Using the data, they interpret the wellbore position and predict where it should bein order to drill the best possible well. With participants from over 20 countries,the only way to ensure that this competition runs without any issues is to use our Solo Cloud solution hosted on AWS.
This year ROGII‘s 4th Annual Geosteering World Cup was the biggest event to date. The competition consisted of over 200 participants and 1 machine learning robot. During the event, there were roughly 10,000 changes made to the cloud every minute, with a processing time of about 0.2 seconds per change. Participants drilled approximately 800 simulated wells in 1.5 hours, which is equivalent to 2 weeks of drilling by all United States operators. To put this on a footagescale, that is about 4 million lateral feet drilled. At the end of the event, analytics provided by AWS was used to identify the champion based on the function of in-zone percentage and high ROP. Though not the winner, ROGII’s robot placed 26th place,which is a big leap for machine learning.
The data from the competition is publicly available for data analytics/machine learning tasks because it is stored on Solo Cloud. Not only is this competition a great opportunity for high-load testing and a way to test and improve automation through machine learning, it is a great to way bring people together. ROGII’s goal is to bring data and people together to continue to strive for excellence. SoloCloud, powered by AWS, makes this possible.

Shout out to our rocky friends in Denver that attended ROGII's Mile High Lunch n' Learn with Jason Edwards, MSc. and Othman Elhelou!
Learned more about StarSteer, had a blasts and enjoyed some great company. Thanks for coming!
Stay tuned for upcoming events!

Our main geosteering event of the year is over! GWC has its new World Cup Winner,Karma Doescher from MCWL Paladin Geological! We are so honored a woman is taking the GWC title of Champion this year! As our competition continues to evolve and grow, we are forever thankful for people like you that make this event a huge success.

This year, we had over 200 participants steering for the Geosteering World Cup championship! From everyone at ROGII, we would like to personally thank those that participated in the GWC this year!


We hope you all had as much fun as we did producing it. Special thanks to our very own Michael Bodack for producing our livestream with Keith Rivera and Stephen Frazier! We would also like to thank our Platinum sponsors GeoVision, Core Geologic, Edge Systems, Terra Guidance, LLC and our Silver sponsors MCWL Paladin Geological and Belloy Geologists!
We'll see y'all next year, for a bigger and better competition! ⭐️💥🏁🎊

This year we have attended the local Norweigian Society of Petrophysicists and Well Log Analysts (SPWLA) chapter in Stravanger with our Geosteering Lead and Technical Analyst Danil Nemushchenko!
The Society of Petrophysicists and Well Log Analysts (SPWLA) is a nonprofit corporation dedicated to the advancement of the science of petrophysics and formation evaluation, through well logging and other formation evaluation techniques and to the application of these techniques to the exploitation of gas, oil and other minerals.
Founded in 1959, SPWLA provides information services to scientists in the petroleum and mineral industries, serves as a voice of shared interests in our profession, plays a major role in strengthening petrophysical education, and strives to increase the awareness of the role petrophysics has in the Oil and Gas Industry and the scientific community.
Thanks for all that attended!


We have some exciting news!!
ROGII is proud to announce seismic data visualization feature on StarSteer and SoloCloud!
With Bluware OpenVDS+ users have fast access to 3D seismic volumes on the cloud using Bluware’s efficient datacompression technology. Users have access to both #geomodels and seismic cubes while #geosteering within a few seconds using just a laptop!

This week we had a great time at IMAGE Conference 2022 - The International Meeting for Applied Geoscience & Energy!
This year we gained new contacts, met in-person with our existing clients, attended and hosted techmical presentations, had lots of fun and more!
Here are some of our lucky winners from corn hole toss & drawing for SONOS speakers!
Thanks IMAGE!


That's a wrap for Houston's Brewston tour with Stratagraph, Inc.Stratagraph Geosteering!
We had so much fun and want to thank those that came. We hope to see you at the next one!


StarSteer 2022.2 is now available!
This release is jam-packed with long-awaited requested features, including:
Be sure to tune into our webinar THIS THURSDAY (August 25th) for a detailed demonstration of all the new features found in the 2022.2 release.
You can register here: https://lnkd.in/ggyPitBy
As always, updated installers and full release notes are available on our Knowledge Base here: https://lnkd.in/eqy-uKV

Thank you everybody for joining our informational webinar with Keith Rivera and Jeff Kriz, P.Geo!
For all our GWC 2022 participants we decided to tell more about the event, give some good tips on how to become A GEOSTEERING WORLD CHAMPION!
There is almost a MONTH left till the World Cup, so don't miss a chance to register if you have not by following the link - register here
If you have missed the webinar, here it is!

And that's a wrap Denver!
We're so happy to hosts these events and bring the community together.
To those that attended our AAPG Happy Hour with Terra Guidance, LLC, thank you for coming! Special shoutout to our very own Jason Edwards, MSc. and Othman Elhelou!


Did you know that the ROGII Technical Support team is a team of professional geologists?
Every Tech Support team member you face by phone or video call can answer all of your questions in detail using their knowledge of geosteering, well placement, logs and much more.
Working hard to answer our clients’ questions, they are also making sure the internal Knowledge Base is up to date and has all the answers to your potential questions.
Our clients love the Knowledge Base because it helps them to easily navigate through our tools and workflows!

That’s a wrap, y’all!
We hope you had a blast at Unconventional Resources Technology Conference (URTeC) ’22 and picked up some cool ROGII swag!
It was a great time to meet our existing clients and seeing new faces, but most importantly, we were able to collaborate and share our knowledge of the latest innovations in ROGII’s geosteering software.


Stavanger, Norway!
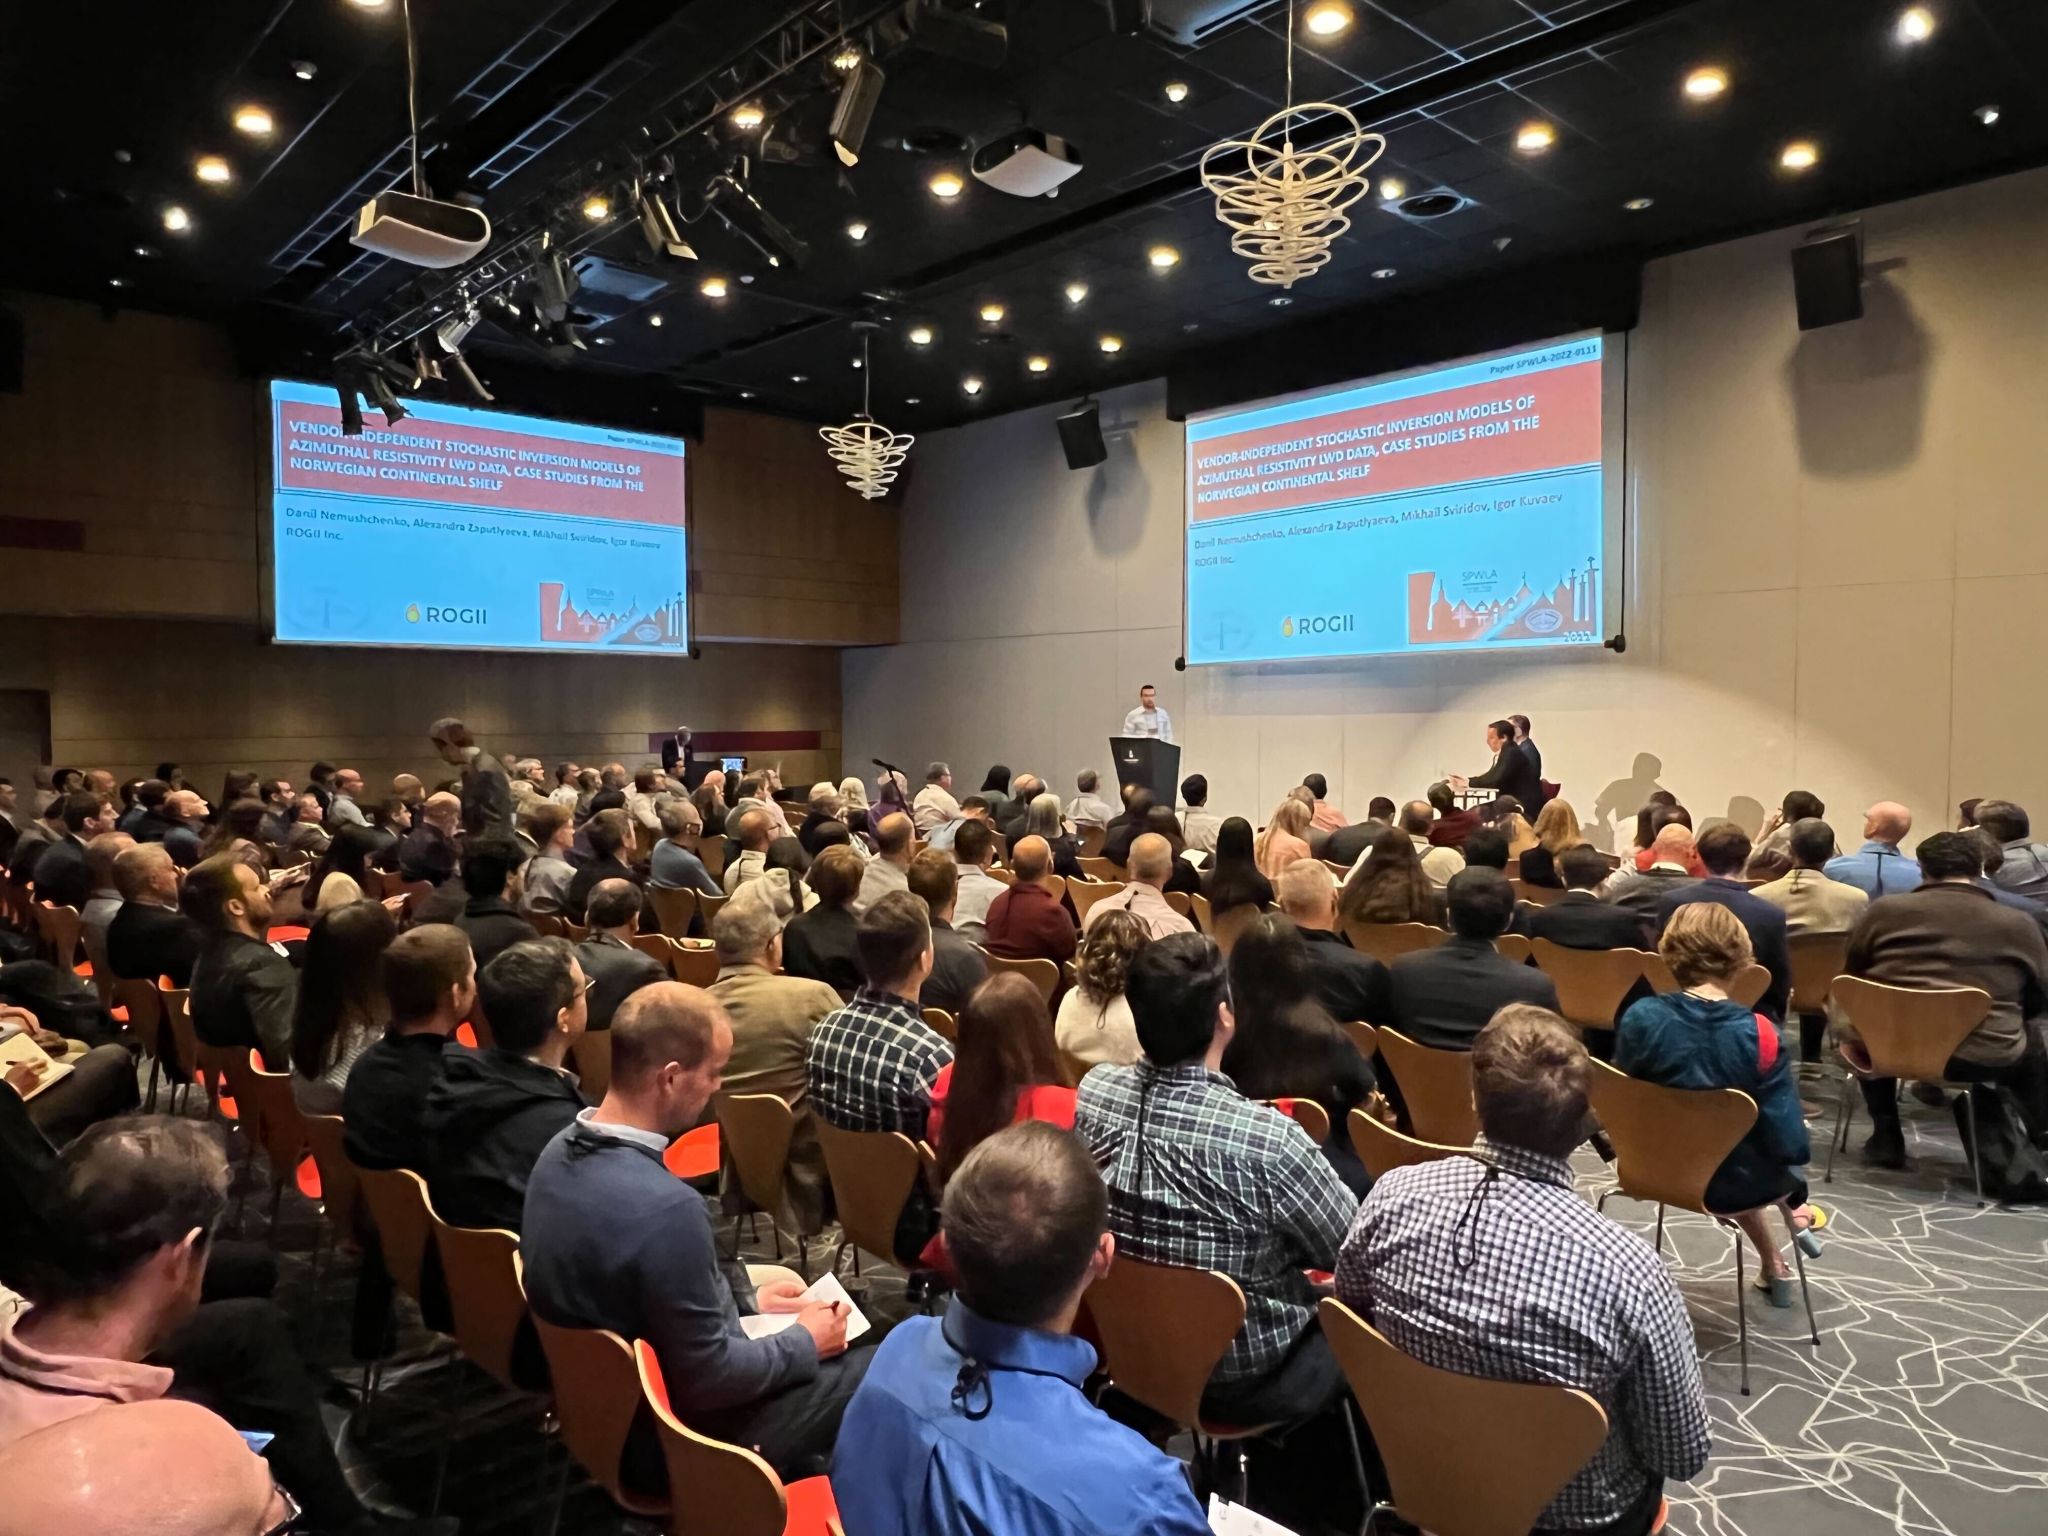
The third day of the Society of Petrophysicists and Well Log Analysts (SPWLA) Annual Symposium is over!
Thank you Danil Nemushchenko for presenting our paper on the Vendor-Independent Stochastic Inversion Models of Azimuthal Resistivity LWD Data from the North Sea.
We look forward to seeing you all and are excited to share our knowledge with you!If you haven’t registered yet, please reach out to Alexandra Zaputlyaeva, PhD, we have couple of free passes for the exhibition!


The third day of the 83rd EAGE (European Association of Geoscientists and Engineers)Annual Conference in Madrid is over!
We hope you had a chance to meet ROGII team and learned how to increase team #collaboration during Real-Time Operations with Tiffani Kennedy!
Come visit ROGII at booth 735.
We look forward to seeing you all and are excited to share our knowledge with you!If you haven’t registered yet, please click here: https://lnkd.in/daWTn8ji


It feels great to be back!
GeoConvention welcomed us with open arms, we’re so grateful to have met new and familiar faces!
We had such gratitude doing our technical talks, product demos, giveaways, and networking with everyone over the span of 3 busy days!
Thank you GeoConvention Partnership and ROGII Canada for the great presentations and hard work!
Please feel free to request for product demos or more information!


ROGII Latin America is finally back in the office with our clients again for training!
This time we are with PAE Exploration's team preparing for their upcoming Mexican Offshore Projects.

Don't miss TODAY's Webinar: New Release Features StarSteer 2022.1!
When: May 19, 2022 at 2:30pm CST
Please register by clicking here: https://lnkd.in/e3ZgnmEFA new #StarSteer release, a New Features webinar!
StarSteer 2022.1 was released early May, and Jeff Kriz, P.Geo and Keith Rivera will show you some of the hot new features to ensure you are getting the most out of StarSteer!
Some of the features he will cover include:
- Improvements to #grid imports, reporting, comment boxes and well workspaces
- Well header importing- #Typewell headers
See you soon!

Thank you GEOLOG International for hosting a great charity golf tournament in Houston.
Regardless the hot temperature everyone had a lot of fun and stayed hydrated with cold beverages provided by Core Geologic and ROGII!

ROGII is pleased to be celebrating 2 years partnership with Petrosys building a successful and collaborative relationship that has delivered software into the hands of our customers, adding significant value to exploration and development campaigns in conventional and unconventional projects. To mark this occasion, we are happy to announce that Petrosys will continue to partner with ROGII and be the exclusive distributor of StarSteer™ and SOLO™ solutions in the Pacific region.
Stephen Clark is rocking it at today’s ROGII U Training Day teaching his Intermediate Course to help existing and future StartSteer users to move beyond the basics learning the Intermediate Workflows in StarSteer!
The ROGII Team had a great second day at International Petroleum Technology Conference (IPTC)! Lots of interest in the latest and greatest resistivity inversion in StarSteer and data aggregation with Solo Box!
ROGII came as not only exhibitors, but also had the opportunity to host a geosteering workshop during education week! Roughly 100 students from top universities around the world participated in the geosteering competition using our software StarSteer and Solo!


We spy with our little eye, an orange box! Our ROGII Team Ryan Schmitt, Mike Wood, Tiffani Kennedy, Keith Rivera, and Jason Edwards, MSc. will be at NAPE Expo LP today for Day 2! We hope to see those attending today!

To kick off 2022, we have a new feature release for StarSteer!!!
We've heard your feed back, and will continue to improve! New Features:
and more!!!

With the challenging geology of oil sands, the well-to-well correlation is not straightforward. Not to mention that the horizontal wells need to be placed as close to the OWC as possible for the best SAGD production.
Using deep azimuthal resistivity tools with plotting logs and without running the inversion is just a qualitative interpretation. Now in StarSteer, it is possible to run stochastic inversion that gives a clue on the proximity of OWC and shaley interbeds.
This inversion is calculated on 5 available curves from the ADR tool.

What a great way to start December! We had so much fun at our Holiday Party, and hope those that attended did too! It feels good to be able to network in-person again!
We would also like to thank those who brought a toy to support our friends Targeted GeoVision, LLC & DATALOG Geological Services, LLC!
See y'all next year!

Last week, Rafael Aguilar attended and spoke at Congreso Mexicano del Petróleo about the benefits of ROGII's digital transformation technology to leverage geosteering operations.
Specifically the importance of the cloud based technology to help teams maintain high performance Geosteering.
Bringing people together. Powered by SoloCloud.


We have new StarSteer videos on our Youtube Channel! We will be uploading one a day, covering all range of workflows in StarSteer, from setting up your project, to accessing and using our Python scripts.
Subscribe and hit the Notification Bell if you'd like to be notified when a new video gets uploaded. We hope the videos are helpful to your everyday work in StarSteer!
Click Here to keep up on all the StarSteer Workflows

Following up on the new 2021.2 StarSteer release, we have an exciting new feature in StarLite we call Rewind. Rewind Mode lets you look back on your well's geosteering history to better understand how those important geosteering decisions were made.
To view the history, click the Rewind button and click play to run the movie, or choose a specific date and time along the timeline to look at a snapshot of your well. Your selected revision time, or snapshot, corresponds to what shows up in your object tree, cross-section view, and what logs existed in your horizontal and vertical tracks, at a specific point in time.
Other new features in StarLite and Solo include:

We've been working on so many new features this summer and we are happy to finally release them with StarSteer 2021.2.All the main StarSteer modules have major updates.
New for this fall release:
Curtain Section (THL): For when the well drastically changes its azimuth. The trajectory is unwrapped as a curtain so that there is no negative section.
Auto-Tops Correlation
Stochastic Multi-Layer Resistivity Inversion
Bulk Las files import
Object Tree search
Opening a Solo project with another user's profile
Create Sidetrack script
And a ton of other great features!
Check out the full release notes for an in-depth description of all the new features being released this fall with StarSteer 2021.2!

Within the StarSteer resistivity module, users have a powerful tool to create beautiful stochastic resistivity inversions that have traditionally been an expensive and rare service. At the SPWLA 62nd Symposium we presented how you, as an operator or independent service provider, can standardize all your deep azimuthal resistivity inversions.
This article is now available on OnePetro. Take a look!
Click Here to be taken to the article

We are proud to announce the release of Solo Connect 3.0!
Your ability to bulk export data from Solo Cloud projects for advanced analytics has been significantly enhanced with the ability to process data in multiple tables: Interpretations, Tops (actual and prog), Target Lines, and Well Trajectories. Combined with Solo Cloud's new ability to "Star" objects as preferred, setting up your data processing profile is now even easier!
Please join us for a ~30 min webinar on Monday, May 3rd for a brief demonstration and Q/A! Registration link below:

StarSteer 2021.1 is now available! This release is full of several highly requested features, including:
1. Comments tied to a specific MD
2. The ability to edit your target line in Map View
3. Import of 3D Geomodels
4. Correlation of gamma wraps in Assisted Geosteering
5. Log color fills in the Correlation Panel
And much more!

ROGII is proud to be at the forefront of real-time drilling operations and cloud data management for the Oil and Gas industry, worldwide. Our team is constantly imagining, innovating, and looking to the future. Enjoy our newest video!
ADNOC, one of the leading global oil and gas companies, is constantly searching for excellence in technology, cost efficiency, and innovations.
We are proud and honored to become ADNOC's provider of best-in-class StarSteer real-time geosteering software, powered by Stratohm technology of resistivity based proactive well placement!
Thank you, ADNOC, for trusting us with this important part of your business!

StarSteer 2020.4 is available today! This release is full of several highly requested features, including:
1. Starred Objects
2. Multiple log export as a single .las file
3. Additional well planning capabilities
4. Addition of Periscope HD, ADR and BoundaryTracker resistivity tools
5. Ability to remove data from Virtual Solo Projects
6. Updated Pre-job modeling Python script
7. Mudlog visualization in Correlation Panel
Be sure to join us Thursday, January 21, 2021, where we'll be going over all the latest and greatest from the 2020.4 release.
So bookmark your calendars and register as this webinar is jam-packed with new features!

Part 4: Applying Predictive Models to Enhance Decision Making
By Andrei Popescu, 4Cast Product Owner
Welcome back to the 4th and final edition of this series on data analytics as a key to the future success of the Energy sector. It’s been a little longer so far than I thought when I initially set out to write these articles, but in truth, we have barely scratched the surface of this deep and complex topic. If you haven’t already, I’d invite you to check out the previous 3 sections:
Part 1: What is Predictive Analytics
Part 2: Data Mining and EDA
Part 3: Data Modelling
Just to recap quickly, we discussed predictive analytics broadly as a variety of statistical techniques that help us to analyze current and historical facts in order to make predictions about future events. We then outlined the data set we had to work with and some specific steps which we would tackle to increase our understanding of the drivers behind production:
Last week we took care of Steps 4 and 5, and we trained both a Random Forest and a Multiple Linear Regression model to predict length normalized 12-month production using the following variables as inputs:
Feature Variables: Proppant Concentration, Fluid Concentration, Stage Spacing, Total Number of Stages, and Average Porosity
So where do we go from here? We now have a model that can predict our future results with a reasonable amount of confidence, so how do we best utilize this model in our future decision making? We could of course manually run a handful of different potential development scenarios through our model, and see how they are expected to perform. If the scope of our future development is fairly limited, this may prove to be good enough, as it allows us to run each specific scenario and see which of them is predicted to achieve the best results. What happens, however, if the question we are faced with is much broader? What if we need to recommend the location and design for the most cost-effective wells to Management as opposed to choosing between a few different pre-planned options?
In this case, there is a myriad of different possibilities we would want to consider in order to ensure that we provide a robust and rigorously evaluated recommendation. As you can imagine, even with the help of our predictive model, manually designing and testing each individual scenario would be incredibly time-consuming, and would undoubtedly leave a large number of potential options on the table un-tested.
Fortunately, 4Cast can come to our rescue once again in this situation. We have at our disposal a tool that allows us to simulate an immense number of different scenarios (upwards of 2 million) very quickly and easily. What this means, is that we can model the results of millions of potential scenarios in a matter of minutes, and then spend our time where it really matters - identifying which of those scenarios is most optimal based on the known constraints of our upcoming development cycle.
Before we move along in our workflow and use 4Cast to simulate our potential future development, let’s discuss the theory behind this algorithm a bit. I want to be perfectly clear that we aren’t going to be generating random or arbitrary well parameters to run through our model as this wouldn’t be effective or useful. There are 2 main reasons that we can’t employ a simple randomization algorithm to generate our simulated scenarios:
To make the best use of both our model and our time, what we want to do is evaluate scenarios that are both realistic (i.e. we could actually see ourselves drilling them), and exist reasonably within the bounds of our training data. Don’t get me wrong, we definitely want our simulated scenarios to deviate from what we’ve already done, otherwise why simulate new development in the first place? But we want to make sure that the range of scenarios we generate is at least somewhat within the range of our training data. After all, how can we expect our model to be accurate if the inputs we present it with are completely unprecedented for it? We created a machine learning model, not a self-aware AI :)
The best way to illustrate how 4Cast can help us achieve this is to simulate a small number of development scenarios first, say 150 of them, and compare those to our existing Wells (see below). The inputs for this function are all of our historic data points (same data we used to train the model), and the output is a set of feature variables (proppant concentration, fluid concentration, stage spacing, # of stages, porosity) for 150 potential future Wells. Below are a series of scatter plots showing the relationships of those variables within our historic data, and those same relationships in our simulated data.


Fig. 1 - Scatter plots comparing the total # of stages (x-axis) vs. proppant concentration (y-axis). The top plot shows the trend for our existing development (wells in our project area), while the bottom plot shows the data we simulated using the multivariate interpolation algorithm in 4Cast. Notice that the overall trend from our real data is preserved in the simulated data, but we have many more points which fill in the gaps of our actual data.
As we can see from the plots above, the multivariate interpolation algorithm does an excellent job of preserving trends that are underlying within our existing data, while also filling in the gaps in our data set which will help us produce a wider and more useful range of predictions. If we plot the remaining variable pairs in a similar fashion, we will continue to see this same pattern where we get clusters of simulated data that have similar parameters to our existing ones but differ just enough to give us a full range of realistic development possibilities. This is an incredibly powerful tool as it allows us to hypothetically execute any “design tweaks” we are thinking of applying, and see what the result of those changes is predicted to be by utilizing our predictive model. As we first discussed way back in the very first part of this article series: if we have a reasonable expectation of what the impact of our proposed design changes will be, we can make better and more informed decisions with respect to what design changes we actually want to commit capital to and execute.
So now that we have this incredible tool at our disposal, we have the freedom of simulating and evaluating virtually limitless different development options in order to identify which one(s) are optimal. For this evaluation, I’ll use the multivariate interpolation algorithm to simulate one million potential new Wells. When I say that we’re “simulating new Wells”, we are of course simulating new sets of Feature variables. Once we employ this algorithm, we will have one million new unique sets of: Total Number of Stages, Stage Spacing, Proppant Concentration, Fluid Concentration, and Average Porosity. If we had built our model to consider different inputs when generating predictions, we would of course want to generate those inputs instead.
We can now take these unique data points and run them through the predictive model we built in last week’s article. This will give us a broad range of possible outcomes to weigh against each other. As you can imagine, with 1MM different scenarios and outcomes, evaluation can be a bit tricky. Fortunately, 4Cast has us covered once again! We can use a heat map to help consolidate all of the information we have into a form that is more manageable and useful to us in terms of making decisions. One of the strengths of the heat map is that it allows us to compare the variables over which we have control against each other, while simultaneously setting constraints for the variables which we do not have direct control over. In our case, we actually have control over most of our input variables (proppant/fluid concentration, stage spacing, # of stages), with the porosity being the only constraint that we can’t directly influence. Let’s say in our potential development areas, the porosity ranges from ~2.5% - 4%, and we want to evaluate what the best options are for setting our other parameters up to maximize length normalized production while minimizing cost. Below we can see the optimal design for maximizing length normalized production is predicted to have 55 stages, 0 tonnes/m proppant concentration, 0.2 tonnes/m^3 fluid concentration, 54 meter long stages, and should be drilled in 4% porosity:

Fig. 2 Heat Map showing results of one million different predictions from our Random Forest model. Each bin’s color represents the length of normalized production. In this case, the x-axis shows the total number of stages and the y-axis shows proppant concentration. The Filters on the right can be used to set up any constraints that are present in the other variables (in this case, we are seeing only results based on the porosity of 2.5% to 4%). Hovering over any of the bins shows the average parameters of wells that fall into that range of normalized production.
The Heat Map in 4Cast allows us to swap between the various input variables we have defined our model to use on the X and Y axes, while also actively filtering the remaining variables based on any other constraints that may exist with regards to our development. If, for example, we wanted to investigate optimal ratios of proppant loading per meter with fluid concentration, we can simply change the axes of the map display and see how these parameters look when cross plotted.

Fig. 3 - Same plot as above but looking at a fluid concentration (x-axis) vs. proppant concentration (y-axis). The highest production per meter is predicted with a proppant concentration of 0 tonnes/m and a fluid concentration of 0 tonnes/m3 of fluid.
So there you have it, we’ve gone through and executed each of the steps we outlined back in week 1. I assure you that while this article series was prepared and published over the course of a month, the process itself was relatively quick and streamlined by utilizing the power of Solo and 4Cast. Depending on the initial data set you have available, an analysis like this could be reasonably carried out in a matter of days or even hours! I realize that this analysis wasn’t by any means exhaustive, and realistically there are many more variables and inputs we would likely want to consider, however, the concepts we discussed and the steps we carried out are more or less the same even with a more complex and varied data set. Off the top of my head, here some additional inputs which would likely be very useful to include in our analysis if we had access to them, and may warrant further investigation:
The list could go on for pages from here as there are so many different variables that can affect the outcome of our Wells. The idea is that by utilizing the approach and methods described in this article series, we can start to compare these various parameters (across disciplines) against each other and start to identify and rank order the relative importance of each. By doing this, we will not only gain a better understanding of our reservoir in a broad sense, but we will also be able to employ more methodical strategies to “engineering” our completion design in order to achieve the most optimal results.
I’ll end the article series here for now, with the caveat mentioned above: there are certainly many more variables at play which we could consider and use to provide a more in-depth and robust analysis. Please feel free to reach out to me directly or leave some comments below if you’d like to continue the discussion! If any of what we’ve discussed has been of interest to you and you’d like to learn more about 4Cast and how you and your Team can apply it to your own data, please contact us at northamerica@rogii.com to set up a demo and free trial. Thanks again for joining me throughout this series!

It's official, the 2020 Geosteering World Cup is in the books! Coming out of the semi-finals it was apparent that Anton Zyabkin was a name to watch as he paced the field with an average success score a full 3 points above his closest rival.
By the time the dust settled on the sand-rich final wellbores of the competition, we found that Anton’s consistency across all wells in the competition left him hoisting the 2020 Geosteering World Cup with a total score of 141.8. South America’s own Andrea Infante’s remarkable run in the second round of the final boosted her all the way to a global #2 ranking and a Latin American Regional Championship with a score of 126.1. Houston’s Pat Tobin took home the North American Championship and a global #3 ranking based on his total score of 118.2. And Australia’s Robin Viljoen rounded out our group of regional champions with a score of 115.2.
Congratulations to our World Cup and Regional Champions and thank you to everyone who participated. You will be sent your certificate, along with global and regional rankings, in the next several days.
Top 10 Global Ranking:
1. Anton Zyabkin, RN-IGiRGI (Europe)
2. Andrea Infante, YPF S.A. (Latin America)
3. Patrick Tobin, OXY (North America)
4. Mystery, Matador Resources (North America)
5. Robin Viljoen, Arrow Energy (Middle East/Asia/Oceania)
6. Jorge Ramón Miguel Estrade, Consultant (Latin America)
7. Evgeny Durasov, SNG (Europe)
8. Stephen Gould, Consultant (Europe)
9. Airat Sabirov, Saudi Aramco (Middle East/Asia/Oceania)
10. Vadim Gimazov, Novatek (Europe)

Part 3: Predictive Modelling and Leveraging the Results
By Andrei Popescu, 4Cast Product Owner
Welcome back the 3rd installment of this series on data analytics as a key to the future success of the Energy sector. Hopefully you’ve found it informative thus far, and if you haven’t already I’d invite you to check out the previous 2 sections:
Part 1: What is Predictive Analytics
Part 2: Data Mining and EDA
Just to recap quickly, we discussed predictive analytics broadly as a variety of statistical techniques that help us to analyze current and historical facts in order to make predictions about future events. We then outlined the data set we had to work with and some specific steps which we would tackle to increase our understanding of the drivers behind production:
Last week we took care of Steps 1 through 3 (and to some extent 4), and came up with the following variables to move forward with:
Feature Variables: Proppant Concentration, Fluid Concentration, Stage Spacing, Total Number of Stages, and Average Porosity
Target Variable: 12-month Production (normalized for lateral length)
So, let’s pick up right where we left off and move to pre-processing our variables. Depending on your definition of data preprocessing, many aspects of it can certainly be considered a part of the initial data mining process which we discussed last week. For our purposes we will generalize data preprocessing as referring to one or more of the following tasks:
Data cleaning
Imputation
Transformation - categorization (binning) or continuation
Feature scaling
The above is by no means an exhaustive list, simply a representation of some of the techniques I’ve found most useful in my projects.
We discussed some aspects of data cleaning and organization in the last article (Part 2: Data Mining and EDA) when we reviewed the data structure of 4Cast. If you’re creating your workflows and preparing data for modeling in Python or R, you will need to spend whatever time is necessary compiling your data into some form of a spreadsheet (usually one or more CSV, txt, or JSON files) and use some custom scripting to combine the data into an organized format where your feature variables can be directly related to your target variable. None of this sounds fun or exciting, but without getting on my soapbox again (see last week’s article) this is the most critical step to ensuring success throughout the rest of the workflow, with few “shortcutting” opportunities.
One incredible advantage that we have working in 4Cast is that simply by using this as our analytical platform, we are working with a data set that is properly cleaned and organized on Solo Cloud, and very easy to QC in 3D (see below). In addition to this, simply by executing regular operational workflows (drilling/geosteering wells, recording log data, etc.) we continually add more and more data to our cloud database to help our future modeling efforts without any duplication of work or interruption to operational execution.

Fig. 1 - Input data structure for predictive modeling. Feature variables outlined in Green, Target variable outlined in Red.

Fig. 2 - Input data visualized in 3D. Wells are coloured based on their calculated proppant concentration (calculated last week). Cooler colors are lower proppant concentration, while hotter colors are higher.
So given that data cleaning is done, let’s look at some of the other operations. Imputation, or replacing missing portions of data with substituted values can be a very useful tool to fill in gaps in data. Some common ways of going about this would be to substitute either the mean or mode of the data we have available in the places where it isn’t. For example, if we had proppant volumes available for 95% of our wells, but not the last 5%, we could calculate either the mean or the mode of the data we do have and substitute it in for the Wells where it’s missing. In our case, the largest gap we have is actually in the production data we have available - every well with production data has all of the other variables (features) fully defined. We’re certainly not going to substitute production values for our missing Wells since the whole purpose of this exercise is to try and predict production in the first place.
Data transformation can be very useful as well. Some common methods for transformation include categorization (binning), and continuization. The two processes are essentially inverses of each other, but let’s outline an example of categorization as I find it to be the more intuitive of two. Imagine we had a data field such as “Facies” available, and we may have our different facies types numbered as Facies 1, 2, 3, etc. This could present a number of problems when it comes to training a machine learning model. For one thing, the model won’t know to treat this value as discrete in the first place, so it may output a result that says the optimal well should be drilled in facies 2, which isn’t a reasonable or useful output. Furthermore, the model could go even further rogue and assume that the order and magnitude of the numbers actually matter. Categorization can eliminate these issues by allowing the model to treat these types of variables as discrete values, and not assign any importance to the order of magnitude of them. With our data set, we are again in an easy position as all of our variables are continuous, though if we had a Facies Log in either our Typewells or Lateral I would certainly use the operations in 4Cast to include this as an input (much like we did with Porosity).
The last step I mentioned above is feature scaling, also sometimes referred to as “normalization” or “standardization”, and we will go ahead and apply this type of preprocessing to our data. Feature scaling can take a number of different forms. For example, data normalization would take all of our training set data and scale it so that all the values fall between 0 and 1 (or sometimes -1 and 1). Standardization is similar but sets the mean of the data to 0, and the rest of the data falls within 1 standard deviation. We will be applying normalization to our data set, and I’ll cover exactly why we want to do this in a moment, but first I want to be very clear about the order of operations. When training a machine learning model, we will be using a “Training” data set, and a “Testing” data set. It is important to split the data into these two sets prior to applying feature scaling. This is because we do not want the data which we use to validate our model to influence the scaling algorithm applied to our data, since the idea is that this is brand new data that has never been seen before. So what we will do is apply feature scaling (in our case normalization) to the training data set, and then when we run the testing data set to validate our model, we will simply use the same exact normalization algorithm on our testing set as we did on the training set - regardless of what values are actually in the testing set.
So why are we bothering with feature scaling? As you’ll see in the upcoming steps, we’re going to evaluate 2 types of models simultaneously - a Random Forest model, and a Multiple Linear Regression model. The reason we need to apply normalization to our features is very clear if we take a closer look at the equation upon which our multiple linear regression model will rely. The equation has the following general form:
y = b0 + b1 x1 + b2 x2 + … + bn xn
So in our case, y is Normalized production, and x1, x2, etc. are stage spacing, porosity, proppant concentration, etc.. What does this look like if we take one of our data points at random, and plug it into this equation:

We get:
2899.8 (Norm prod) = b0 + b1(0 prop conc.) + b2(0 fluid conc.) + b3(54 stage spacing) + b4(57 stages) + b5( porosity)
Our input/output values range in magnitudes from 10^-2 for porosity, to 10^3 for Normalized production. With this type of variance, it will be incredibly difficult to accurately determine which factor is playing the greatest importance in predicting the Target (i.e. which bn matters most). By applying feature scaling, we set everything on the same magnitude as all of our values will lie between 0 and 1. We can see below the results of applying a simple normalization algorithm to our data set in order to normalize our variables to a scale of 0 to 1:

Fig. 3 - data prior to feature scaling (normalization)

Fig. 4 - data post feature scaling
Awesome. So now we have all of our data cleaned up, organized, and preprocessed. Let’s build some machine learning models! As I’ve been doing all of my work in 4Cast, I’m using Orange as my platform for applying these algorithms and building the models. 4Cast and Orange have a seamless connection which allows for all of this to be done incredibly quickly, and in a visual format - no complicated code required! Below is a snapshot of my workflow.
The first few steps are fairly straightforward - we are essentially defining the feature and target variables as we have outlined previously. Next we use the data sampler to split the data set into a training set (75% of the data) and a testing set (25% of the data). From there, we normalize the training set only - again, we don’t want our testing data to have any influence on the normalization process. Instead, we preserve the normalization function applied to the training and pass it to the model for application to future data.

Fig. 5 - model building pipeline. Notice that we split the data into a training and testing set prior to applying feature scaling. The scaling methods are then also passed to each model for use with future data inputs. Each model is evaluated using 10-fold cross-validation, then the model predictions for both the training set and the testing can be compared to the historic data in cross plots (below).
As you can see above, we have several tools for evaluating our models. The 10-fold cross-validation gives us some fast, quantifiable summaries of the results. Both models show reasonable correlation coefficients, with the Random Forest model edging out our Multiple Linear Regression by a bit.


Fig. 6 - Results of model cross-validation. R2 (R-Squared) shows the Random Forest model to be a more reliable model for predicting our target. On the right is a rank order of the importance of each variable in the models - overall, the main drivers are the total number of stages and the proppant concentration.
The last thing we want to do in order to test our models is to present them with brand new data that they haven’t “seen” yet - this is where our testing data set comes in. If you refer back to Fig. 5, you’ll see two outputs coming from the Data Sampler. The lower one represents our training set which was used to train these models, the upper one is the remaining 25% of our data which we will now pass to our models to generate new predictions. If our models are robust, they should be able to take this brand new data and accurately predict the normalized production based on the input variables. I’ve summarized the results in the scatter plots below:


Fig. 7 - Results of Test data set. In both graphs, the X-Axis shows the actual (historic) Normalized Production values. The Y-Axes show the Random Forest predicted production (top) and the Linear Regression predicted production (bottom). Both models do a reasonable job of predicting the production based on the inputs, with the Random Forest model showing a slightly better correlation.
There you have it! We’ve now generated two perfectly viable machine learning models which can be used to predict Length Normalized Production based on the following inputs:
It seems a little too easy, right? The reality is that 4Cast and Solo Cloud did most of the heavy lifting when it comes to the hardest part of this whole process which is data management and organization. I would also be remiss if I didn’t mention that there is certainly much more work that can be done to further refine these models, not the least of which includes expanding our data set to include more data points, and also more refined data types. Given our data set here, the main drivers are overwhelmingly the Total Number of Stages and the Proppant Concentration, but there is a myriad of other potential variables we can (and should) include in this type of analysis. For example, if we had seismic attribute maps, we could sample these values to our Wells to see what effect that property has on our outcome. Perhaps we should include the completion timing or order in which the wells were drilled as a variable. We haven’t even considered parent-child relationships, or whether any of these Wells were knocked down by offset frac hits. Needless to say, the possibilities for taking this simple workflow to the next level are nearly endless, but now we have a platform within which we can explore all of these possibilities ad nauseum.
I’ll leave it there for now as I think I’ve gone on for long enough. I’ll be back next week to preview an incredible tool that can help us make efficient use of our new models in future decision making. As usual, please feel free to reach out to us at northamerica@rogii.com or contact me directly if you have any questions, comments, or simply want to discuss. Thanks again for your time, and looking forward to keeping the discussion going!

We'd like to publicly congratulate our finalists for the North America and Latin America region.
Tune in tomorrow to see the finals and see what Region takes home the Geosteering World Cup!
The event goes live tomorrow at 11:00 AM CST! If it's anything like the semi-finals, you definitely won't want to miss it!
To watch the live event click Here.
Here's a full list of the Finalists competing in tomorrow's World Cup
North American Finalists
Evans Darkwa: Evans works at Diversified Well Logging, LLC he has 15 years of work experience as a Geologist. He enjoys reading and is a soccer fan.
Kevin Pelton: Kevin has 10 years of work experience. He enjoys camping and playing board games with friends.
Mike Bodnar: Mike works at Cabra Consulting in Calgary. He has 8 years of work experience and enjoys rock licking and collecting chopsticks.
Ethan Cook: Ethan works at Antero Resources and he has 1.5 years of geosteering experience. He enjoys spearfishing and playing chess.
Patrick Tobin: Pat works at Oxy and has 10.5 years of work experience. He enjoys playing basketball and eating pasta.
Brad Moon: Brad has 40 years of experience and is currently working as a Consultant. He enjoys hiking mountains, singing, and politics.
“Mystery”: Works at Matador Resources.
Chris Bender: Chris works at Gordon Technologies LLC. He has 13 years of work experience in M/LWD and the last 9 in geosteering. He enjoys flying drones commercially, learning Python for data engineering, and taking cybersecurity classes.
Jeremy Kassouf: Jeremy works at Chevron and he has 12 years of work experience. He enjoys whitewater kayaking, rafting, live music, and attending music festivals.
Kevin Glass: Kevin has 5 years of work experience in Oil & Gas. He enjoys mountain biking, skiing, hiking, etc.
Tyler Shade: Tyler works at Raptor Consulting and has 4 years of work experience and enjoys skiing and cycling.
Kevin Strode: Kevin has 10 years of work experience. He enjoys spending time with his daughters, reading fantasy novels, and building stuff in Minecraft with his daughter.
Karma Doescher: Karma is the Director of Geosteering at MCWL Paladin Geological. She has 6 years of experience in Geosteering, Operations, and Mudlogging. Her hobbies include coddiwompling and working on her top-secret invention.
Jesse Merchant: Jesse works at Calyx Energy III, LLC and has 11 years of work experience. He loves any excuse to be outside.
Jacob Leader: Jacob has been at Cimarex Energy for 6 years. He enjoys pottery and playing tennis.
Bill Honsaker: Bill is a Geologist with 9 years of work experience. He enjoys road/gravel cycling.
Jon Krystinik: Jon is an Independent Geosteering Geologist with 20 years of E&P experience. He has steered over 1,000 horizontal wells and enjoys family, autocross, and spending time out on the outcrop.
Dakota Kubler: Dakota Kubler is a Geosteering Consultant he enjoys fantasy football and hiking.
Ryan Rambo: Ryan is an Operations Geologist at WPX Energy.
“Enigma”: Player 97 works at Matador Resources.
Bill Larzelere: Bill works at Continental Resources has 8 years of work experience and enjoys playing soccer as a hobby.
Nicholaus Driscoll: Nicholaus has 8 years of work experience and enjoys woodworking.
Christopher Padilla: Chris has 10 years of work experience and currently works as a Freelance Operations Geologist. He enjoys playing guitar and camping.
Katrina Ostrowicki: Katrina Ostrowicki has 8 years of experience working at Chevron as a geologist, with 2 years of that being a Geosteering Specialist. She has experience geosteering Marcellus, Utica, Permian Basin, and Vaca Muerta wells. Her hobbies include aerial silks, fostering dogs from the local Houston animal shelter, and hiking with her fiancé and foster dog.
Sarah Regen: Sarah works at GeoVision as Geosteering Manager. She has 8 years of experience and enjoys cheesemaking and studying for her grad school classes.
Matt Minnett: Matt is employed at Shell Canada Ltd., has 6 years of Geosteering experience and enjoys hockey, hiking, and camping.
Christopher Perry: Chris works at Ovintiv.
Ghazanfar Zahid: Ghazanfar has 20 years of work experience in the oil and gas industry, 15 of those years were spent providing geosteering services for Haliburton and Baker Hughes. He enjoys hiking and swimming.
Danica Watson: Danica has been at Cimarex since March as a Geosteering Specialist. Before that, she was at Apache for 3 years as an Operations Geologist and Geosteerer. Prior to that she worked at Chesapeake as a Geosteerer for 2 years. She has over 6 years of work experience and enjoys reading, play trivia, hiking, and skiing.
Jason Harms: Jason has 9 years of work experience and enjoys skiing and mountain biking.
Latin America Finalists
Andrés Damián Askenazi Vera: Andrés is a Geologist with ten years of experience in the oil industry, mainly in unconventional projects, and the last ones developing Geosteering tasks. He enjoys traveling to mountainous areas and nature reserves as well as trail running.
Jorge Ramón Miguel Estrade: Jorge has 5 years of work experience as a Wellsite Geologist. He enjoys camping and cycling.
Andrea Infante: Andrea is a Geologist with 8 years in the oil and gas industry. She started her career in mining and has since dedicated her time working on geosteering projects in conventional and unconventional reservoirs. She enjoys any outside activities like trekking, nature, and swimming.
Noelia Caterina Di Giuseppe: Noelia has 3.5 years of work experience and enjoys singing and reading novels.

Part 2 – Data Mining and Exploratory Data Analysis (EDA)
By Andrei Popescu, 4Cast Product Owner
Let’s start by recalling the broad definition of predictive analytics from last week’s article: a variety of statistical techniques that help us to analyze current and historical facts in order to make predictions about future events. And now let’s take that definition a step further by pointing to the specific statistical techniques I’m referring to. I believe we can break down the process into 4 key components:
1. Data mining (collection) and clean-up
2. Exploratory Data Analysis (EDA)
3. Training/refining data models
4. Generating and evaluating predictions
Something I’ve seen commonly throughout my career is a heavy focus on getting to steps 2, 3, and 4 (the fun stuff), with as little time and resources spent on part 1 as possible – after all, we need to do more with less, and we need to do it quickly, right? I’ll take a hard stance here and say that part 2 will be very difficult, and the results of 3 and 4 will be mostly useless if we don’t change our mentality. Everybody’s heard the adage “garbage in, garbage out”, but the problem is that nobody believes that their data is garbage. The harsh reality that most don’t consider is that while their data may be excellent if it’s not compiled and organized in the appropriate manner, it’s as good as garbage. A Forbes study on actual time spent by data scientists would agree with me here, the graph below shows that roughly 80% of the process (and time/effort spent) is taken up by collecting, cleaning, and organizing data. Only then do we get to start having fun!

So let’s discuss the first component - data mining and clean-up. What this means is that our data not only needs to be compiled in one place, but it also needs to be organized in a consistent format. In last week’s article, we defined the following Steps we would be tackling:
1. Define the target variable that we want to predict which can help inform our strategic decisions - in this case, our target will be 12-month Production
2. Compile and visualize the available data in a consistent format, and one that can be directly compared to our target - since 12-month Production is measured at the Well level, our data should be organized and reported at the Well level also
3. Identify existing trends/patterns within our data and define dependent relationships
4. Select and preprocess input variables - these input variables should be quantities that can be known with a high degree of confidence prior to drilling new wells
5. Build, test, and refine data models until we have one which can accurately predict historic results based on the defined input variables
6. Simulate a large number of potential future development options, and use the data model to predict the results
7. Identify the simulated option which is predicted to achieve the optimal result
We also completed Step 1 on the spot - we decided that our target variable to be predicted would be 12-month Production. Great. This week we’ll focus on Steps 2 and 3. So, given this, our next course of action is to compile the rest of our data in a consistent format, and one that can be directly compared to our target - so we need to organize our data on a well level basis - this step is where 80% of the project time is usually spent!
Fortunately for us, this is exactly where 4Cast and Solo Cloud help to make this process both easy and visual. Most companies in North America are already using StarSteer to drill and geosteer their wells (and if you aren’t perhaps you should be 😊) since 4Cast shares a common database with StarSteer through Solo Cloud, the first step in building a project is already complete as we can just connect to an already existing project in Solo. By doing this, we instantly have access to all of the trajectory, log, and geosteering data which has been created, compiled, and QC’d as a part of the standard operational workflow.
Of course, we want to bring in and calculate additional data to help with our analysis. In our example, we’ll start with the following high-level data which is usually publicly available:
· Stage depths (start and end MD of each stage)
· Fluid/Proppant volumes per stage
· 12-month Production per Well

Fig. 1 - 4Cast data structure accommodates variables to be defined and stored either at the Stage or Well Level. There is no limit to the number of columns we can define/import/calculate.
As you can see above, the data structure in 4Cast allows us to store any data we have at either the Stage or Well level, and it will automatically use certain Stage level attributes to calculate new attributes at the Well level. In this case, we used the Stage depths to calculate Completed Length, and the fluid/proppant volumes per Stage to get a total value for each Well - remember, since our Target variable (production) is measured at the Well level, we need our Feature variables to be organized in the same way. It’s also worth noting, that these column definitions aren’t set in stone - we can import/define custom columns depending on the data we have available, and also calculate new ones using our existing variables, as well as our Log data and Geosteering Interpretations.
Given that we have access to our Geosteering Interpretations, as well as the Typewells and Logs that were used to steer these Laterals, a logical next step would be to calculate some new variables using this information. In this data set, I had the benefit of Bulk Density and Density Porosity Logs in my Typewells. 4Cast allows us to use these Logs along with our Geosteering Interpretations to model these properties along all of the Wells in the project very quickly and easily. The results can be seen here:

Fig. 2 - Average Density Porosity calculated on a per Well basis for all Laterals. Results range from 0.5% (Blue) to 4.5% (Red). All calculations are automatically output to the Stage/Well spreadsheets, the 3D Colour View allows us to quickly and easily visualize and QC any of the data from the spreadsheets.
As you can see, we are already well on our way through Step 2 - we have compiled our available data in an organized and consistent format, and we can quickly QC it to identify broad trends or outliers. In the case of Density Porosity (shown above) our Wells are modeled to have an average of anywhere from 0.5% to 4.5% porosity, which is in line with expectations for this formation. To recap, the variables we now have available for our Wells are as follows:
Feature Variables: Completed Length, Number of Stages, Total Proppant, Total Fluid, Average Porosity, Average Bulk Density
Target Variable: 12-month Production
With a total of seven relevant feature variables, many of which we can meaningfully control in our future development plans (how long we drill our Wells, how many stages we pump, etc.), we could reasonably try to start training a data model to predict production right away. But before we get too ahead of ourselves, it would be a good idea to do some simple Exploratory Data Analysis (EDA) in order to familiarize ourselves with the data set. EDA is a broad term that could refer to a number of different techniques, but for our purposes, we’ll keep it straightforward - we want to investigate and summarize the existing trends in our data using visual methods. The goal is to potentially refine our input variables further, prior to moving on to training and refining a statistical model. There are a number of ways we could go about this next step, but my personal favorite is simply to start creating scatter plots of our various variables:

Fig. 3 - Plot of Completed Length vs. Total Proppant. Points are sized based on the Number of Stages and colored based on 12-month Production. A strong correlation here is not unexpected but indicates multicollinearity in our data set, which could cause problems for our future model.
I’ll spare you the summary of all the cross-plots I created (suffice it to say there were many) and we can focus on the important learnings from this exercise. By doing this simple analysis, we uncover that we have numerous variables that are actually quite closely correlated. This is an issue called multicollinearity - where changes in one of our independent variables are associated with shifts in another. Below is a summary of the dependencies which stand out:


Fig. 4 - Completed Length is closely tied to Total Proppant, Total Fluid, and Total # of Stages. Additionally, Average Porosity and Average Bulk Density have a nearly 1-to-1 relationship.
Some of these dependencies should come as no surprise, however, it’s important to note these and think about the effect these co-dependencies will have on our statistical model. Given that a large part of our goal is to understand the effects that each individual parameter has on 12-month Production, we should consider modifying our input variables. The reason for this is that including too many co-dependent variables will make it difficult for the model to distinguish the individual effects of each variable because the co-dependent variables tend to change in unison.
Looking at porosity and bulk density, we can see that these variables have essentially a perfectly dependent (or 1-to-1) relationship. In this case, we would actually be best served to simply remove one or the other altogether to avoid overfitting the model. With regards to Completed Length, it has a fairly close tie to the Total Proppant, Total Fluid, and Total # of Stages in our Wells. Again, this is to be expected but is also a little concerning since we can pretty easily extrapolate these co-dependencies to conclude that any model we build will assign a massive amount of importance to these variables as a group. This will result in us learning that longer Wells with more Stages, Fluid and Proppant pumped will give us better Production, but won’t actually tell us which of these variables individually is most important. I’m not sure about you, but to me, that sounds like an altogether useless result. So instead of blindly plugging our data into a machine learning algorithm and blaming “useless AI” for not giving us relevant answers, let’s instead see if we can’t modify our data set somewhat.
A simple thing to try at first would be to normalize Completed Length entirely. So specifically, let’s calculate the following variables to replace the co-dependent ones we identified above:
Fluid Concentration = Total Proppant ÷ Total Fluid
Proppant Concentration = Total Proppant ÷ Completed Length
Stage Spacing = Completed Length ÷ Number of Stages
While we’re at it, since we want to normalize Completed Length out, we should also change our Target to be 12-Month Production on a per Length basis:
Normalized Production = (12-month Production ÷ Completed Length) * 100
Now, we can not only remove Completed Length from our input variables (since it is represented within our new Features and new Target), but if we look at a summary of our Input Variable dependencies, we see that our Inputs are far more independent of each other.

Fig. 5 - We can see the correlations between our new Target Variables are much lower than seen with the previous variables.
Our new data set is as follows:
Feature Variables: Proppant Concentration, Fluid Concentration, Stage Spacing, Total Number of Stages, and Average Porosity
Target Variable: Normalized Production
I think I’ll leave it there for this edition. To recap, we’ve compiled our data set, investigated some of the underlying relationships, and did some simple analysis and data manipulation to ensure that our input data set is one well-suited to predictive modeling, and promising in terms of giving us valuable insights to take forward. We’ll save data preprocessing, predictive modeling, and evaluation of our results for next week. Thanks again for your time in reading this, and I look forward to hearing from you and continuing the discussion. As always, be sure to follow us to get the latest and greatest on everything Rogii related, and please don’t hesitate to reach out to our Team, or to me directly if any of the content here has piqued your interest!

Part 1 – What is predictive analytics?
- Andrei Popescu, 4Cast Product Owner
Big Data, Machine Learning, Cloud Computing, Predictive Analytics. We hear “buzz words” like these more and more in our industry these days. To many, these words imply progress, a technical (or technological) advancement in the way we manage and operate our fields compared to current practices, which can drive efficiencies and ultimately increase profit margin. By and large, I think the general consensus is that we should be applying these concepts and techniques in our operations, but the field seems not only split on how to best do this, but also to some extent on what these things even mean for the oil and gas sector.
As we’ve recently released our new platform 4Cast, I’d like to take a deeper look specifically into predictive analytics, and how it can be applied to oil and gas data sets to help make more optimal development decisions in our fields. While I’ll focus on core concepts of predictive analytics, I’ll note that we will of course touch upon the other buzz words mentioned above as well. After all, 4Cast is a cloud-based platform designed specifically to streamline the application of statistical analysis and Machine Learning algorithms to oil and gas data. I think I just hit most of the aforementioned buzz words in a single sentence 😊
So, what is predictive analytics? Broadly speaking, it’s a variety of statistical techniques that help us to analyze current and historical facts in order to make predictions about the future, or other otherwise unknown events. I got that from Wikipedia, but I can’t think of a more accurate way to put it. More concisely for our purposes: we want to use our existing Well data to predict what will happen with our future Wells. The main reason we would want to do this is to make better, more informed development decisions. If we have a reasonable and reliable expectation of the outcome of our actions, we can “simulate” multiple possible scenarios, and choose the scenario that results in the most desirable outcome from among the simulations.

Fig. 1 - A developed asset with 90+ Wells drilled over the course of several years. Completion systems and design varies across all wells, as do the results. Wells are colored based on 12-month cumulative production.
Let’s take for example a situation, as shown above, an asset with several years of existing development. This year, we have a certain fixed budget to drill and complete new wells, and we need to manage that budget in order to maximize production while minimizing cost - a situation many can relate to, I’m sure. In order to make the best use of our budget, we need to understand the effects that different parameters will have on our outcome. In this case, the parameters are the known characteristics of our reservoir (geological, petrophysical, etc.), Well design (drilling target, well spacing/stacking, etc.), and Completion design (proppant/fluid concentration, stage/cluster spacing, etc.), and the outcome is production.
A common approach to try and increase our understanding is to turn to “Frac Modelling”, or using defined physical and mathematical equations or relationships to define the size and shape of our fractures in the subsurface. Don’t get me wrong, I think this is a noble endeavor and certainly has merit as one of many variables involved in the overall picture. However, I believe that by focusing too much on this singular aspect, which is incredibly difficult to validate, we risk missing out on a large number of insights our data can provide us without knowing the exact size and shape of each individual fracture.
Consider that we have access to decades worth of data where various Well and Completion designs, which are known quantities, were applied. The production results of these different trials are also known with a high degree of certainty. Combine these knowns with additional geologic and geophysical data which can constrain reservoir quality and wellbore point of contact. What we have then is a large data set with many known, independent variables and a dependent variable – this is exactly what we need in order to put predictive analytics and the rest of the buzz words to practical use. Given data sets where we know the inputs (or many of them at least) and we know the results of those inputs, we can use well defined and rigorously tested statistical techniques to increase our understanding of the effects of each of our known variables on the outcome. Specifically, we can train and refine data models using machine learning algorithms to be able to predict outcomes, based on the known input variables.

Fig. 2 - A general outline for a predictive modeling workflow that can be applied to any dataset where we have known independent variables alongside known results. We’ll go into more detail for each of these steps in the subsequent articles using the example asset shown in Fig. 1.
Using the example situation from above of wanting to maximize production while minimizing cost, let’s first define our strategy for doing this in concrete steps:
In the subsequent articles in this series, I’m going to tackle each of the steps we just outlined using 4Cast, and a real data set. By doing so, we’ll take a deeper dive into what I believe are the key components of predictive analytics. Hopefully, this framework and example will help you to outline whatever questions are most important to your Team and apply an analytical approach to answering those questions.
Thanks for taking the time to read through my introductory thoughts on this topic, and hopefully I’ve piqued your interest to come back for the next edition. I would welcome anyone who has additional insights or would like to discuss anything I’ve mentioned here in greater detail to please chime in in the comments or reach out to us directly. Please be sure to follow us for the latest news on 4Cast, and to catch the follow-up articles in the coming weeks.

Geosteering World Cup Master FAQ
When will the Geosteering World Cup take place?
The Geosteering World Cup will consist of an Opening Round and a Final Round. The first round will take place on November 10th (Worldwide) from 1:00 – ~3:00 PM CST (North America region). The highest scoring competitors from the initial round will advance to the final round which will take place on November 17th (Worldwide) at 1:00 PM CST (North America region). Please look below for other region times.
Who can participate in this event?
This is a free event that is open to everyone to participate in. Participants will be divided up into regions depending on their country of residence.
What is the regional breakdown?
We have broken down the competition into 4 regions, they are as follows: North America, Latin America, Europe, & the Middle East/Asia/Oceania. Competitors from all regions are able to compete in either heat during the opening round as is more convenient for them.
Can I participate if I don’t have a StarSteer license?
Absolutely, we designed this competition to be open to everyone. If you do not have StarSteer installed on your computer or your license has expired we will provide you with a temporary license key to practice before the competition & participate in the event. If your computer cannot run StarSteer due to technical specs we will supply you with access to a Virtual Machine to facilitate this access. Participants in need of StarSteer will receive access 10 days before the competition.
How will the cup be conducted?
The cup will be hosted on ROGII’s Solo Cloud Platform and using ROGII’s StarSteer Geosteering Software. At 1:00 PM CST the competition will go live for the following regions: North America and Latin America, please see below for Europe & Middle East competition times. Competitors are encouraged to have logged into their accounts prior to the competition to identify any issues. Once the event begins competitors will have 2 hours to steer 2 wells, 1 conventional & 1 unconventional. The basins these wells are generated from will be announced prior to the Opening Round.
Is there a difference per region?
There are no differences between regions however the wells steered in the two different heats will be different as they are not happening simultaneously. Users from all regions can compete in either heat as is convenient for them. In the final, all competitors will be competing with each other directly using the same data.
What data will be used for the competition?
We will be using synthetic data for the competition generated from current public data. The basins which will be drilled in the competition will be announced prior to the Opening Round.
How will I be scored?
Participants will be scored on a combination of 2 factors: the highest percentage drilled in the Target Zone and average ROP. Each participant will receive their composite score as well as the solution after each well is completed.
How will my scores be compared to other participants?
Participants will receive their individual composite score for each well, their overall placement in the round, & position within the competitor pool.
What tools are expected to be used during the GWC?
Tools used during the competition for the conventional well include, but aren't limited to, MWD & LWD data. The competition may include steering with additional LWD data besides gamma.
Can you teach me to geosteer?
Unfortunately, due to a large number of registrants, we cannot teach participants in an individual manner. We will provide resources to learn on your own & provide technical assistance via email up to a week before the competition. If you are interested in learning more about our software or geosteering make sure to keep an eye out for our future ROGII U Geosteering courses & webinars.
What can I do to practice before the competition?
A project will be released 2 weeks before the competition using elements similar to those displayed in the Cup. Completion of this project is not mandatory to participate in the event. You will also have access to StarSim, our geosteering simulator when you receive StarSteer access.
When will the Competition briefing occur?
ROGII will host multiple briefings on November 5th to ensure all participants have StarSteer installed & are ready for the competition.
When will I be notified if I make it to the finals?
Participants that have made it to the finals will receive a notification by email on November 11, 2020.
When will the winner be announced?
The Geosteering World Champion will be announced on November 20 via LinkedIn & ROGII News.
What does the winner receive?
The overall World Champion will receive the 2020 Geosteering World Cup Trophy along with an Apple Watch. The champion will be recognized as the “Geosteering World Champion” & Champion of his/her region. Winners for the other three regions will be identified as “Regional Champions” and will receive an Apple Watch & a Certificate recognizing their accomplishment.
Will my scores be published publicly?
No, the only scores that will be made available to the public via social media and our website are those of the World Champion & Regional Winners. After the final round has been completed, we will list the top 20 finishers in order of rank. However, you are free to publish your scores & share them publicly as you wish. If for some reason you wish to compete anonymously please contact us directly and we can make arrangements for you.
What are the competition times?
North America
i. Houston, TX: 1:00 PM (CST)
ii. Denver, CO: 12:00 PM (MST)
iii. Calgary, AB: 12:00 PM (MST)
iv. Pittsburgh, PA: 2:00 PM (EST)
Latin America
i. Buenos Aires, AR: 3:00 PM (AST)
Europe
i. Moscow, RU: 2:00 PM (Moscow Standard Time)
ii. Paris, FR: 1:00 PM (CET)
iii. Hamburg, DE: 1:00 PM (CET)
iv. Oslo, NO: 1:00 PM (CET)
Middle East/Asia/Oceania
i. Abu Dhabi, UAE: 3:00 PM (GST)
ii. Doha, QA: 2:00 PM (AST)
iii. Dhahran, SA: 2:00 PM (AST)
iv. Perth, AU: 7:00 PM (AWST)
Who can I contact if I have more questions?
You can email us at worldcup@rogii.com for any further questions.
This sounds Fantastic! Where can I sign Up?
We're glad to hear! Participants can Register Here

When we first introduced StarSteer back in 2014, it was a multi-well, multi-log geosteering platform. Requests and feedback from our user community led us to develop functionality for Mapping, Well Planning, Correlation Panel, Completions Data Integration, Resistivity Modelling, and more.
StarSteer development has been the direct result of feedback and interaction with our user community. Thank you for your support over the years! We are excited to show you what features are coming up next!

Pan American Energy has recently completed drilling a horizontal well in the Lindero Atravesado area in Vaca Muerta. The 2,795 meter, side-section well was carefully landed and geosteered within a narrow target window of the Vaca Muerta Formation which spanned just 3.4 vertical meters in thickness across the entire lateral section.
The very precise geosteering of this well was carried out by the PAE subsurface team in conjunction with ROGII’s Latina geosteering team. PAE uses specialized software combined with collaborative cloud-based technology to enable real-time monitoring, interpretation, and decision-making allowing effective communication between specialist teams while fully complying with social distancing standards.
To achieve the complete placement of the almost 2.8 km of lateral section in less than 4 meters of vertical thickness, the cooperation and commitment of diverse specialists each contributing their best performance was necessary to achieve this success.
Representing a milestone at Pan American Energy as the best positioned horizontal well within the planned geologic target, this well is proof of technical evolution in the accuracy and effectiveness of geosteering and drilling engineering workflows.

Solo Cloud has reached Australia! It's a pleasure to welcome Beach Energy to the Solo community. We are looking forward to seeing our technology at work in the Cooper basin!

ROGII proudly welcomes Saudi Aramco to our distinguished community of StarSteer users!
For 87 years, Saudi Aramco has maintained a reputation for technological excellence and Rogii’s innovative approach to operations and data access will only serve to enhance that esteemed tradition. We are all looking forward to advancing into this new, digital era for our vital industry together!

"Houston, all systems go for launch!"
Unlike some other stellar themed corporations, the ROGII team is proud to announce the successful launch of StarSteer 2020.2 this morning.
This release is packed with new functionality including major updates to:
- Polygon Colorfill and Labels available in Map View
- Massive Improvements in the Correlation Panel
- Enhanced Target Line/Well Planning Capabilities
....much more!!
Join us at our June 3rd Thursday Webinar to see all the new features in action!

Geothermal is not generally something that gets much press in the renewable energy discussion. Historically, it has only been viable in regions with a shallow heat source and porous, permeable rock for water to flow through. This only leaves a handful of places in the world where geothermal energy can function at commercial levels. Eavor Technologies out of Calgary has leveraged unconventional petroleum technologies in horizontal drilling as well as Rogii’s StarSteer geosteering software to potentially expand the geothermal commercial envelope exponentially.
Eavor’s technology consists of creating a closed loop system of subsurface wells which takes advantage of a thermosiphon effect whereby hot fluids rise in the inlet well while cool fluids fall in the outlet well. In order for all of this to happen, two mirror image horizontal wells must be drilled to sufficient depth and steered to connect at their toe in the subsurface. The precision geosteering required to do this was provided by Chinook Consulting out of Calgary. Additionally, specialized magnetic ranging sensors (a technology widely used in thermal oil developments) were used to provide terminal intersection guidance once the wellbores were within 30 meters of each other. The importance of precision geosteering towards the successful intersection of 2 wellbores 2+ km underground can’t be overstated. Inherent directional survey rounding errors and the wells’ cones of uncertainty are common challenges when navigating reservoirs with horizontal wells. “Precision geosteering throughout the lateral sections allows the two wellbores to head at each other at the same stratigraphic level, setting the stage for magnetic ranging in the later stages of intersection,” Calin Dragoie of Chinook explained.
Well overlay across Calgary (photo credit: Chinook Consulting)

This innovative application of unconventional petroleum technologies like horizontal drilling, advanced mud systems, magnetic ranging sensors, and StarSteer could allow geothermal energy to greatly expand its potential footprint and scale up the energy intensity of geothermal developments. Further, the ability to sidetrack and connect mirror-image daughter wells from both the inlet and outlet wells allows for the scaling of this technology to be customized to suit the area it is meant to service.
For more information on Eavor Technologies, Chinook Consulting, or Rogii (StarSteer), please visit their respective websites:
·https://eavor.com/technology/
· https://chinookpetroleum.com/
·https://rogii.com/


